1-D plot of a numeric score by means/standard deviations computed using an external table of weights
s1d.distri.RdThis function represents a set of distributions on a numeric score using a mean-standard deviation display
Arguments
- score
a numeric vector (or a data frame) used to produce the plot
- dfdistri
a data frame containing the mass distribution in which each column is a class
- yrank
a logical to draw the distributions sorted by means ascending order
- labels
the labels' names drawn for each distribution
- at
a numeric vector used as an index
- sdSize
a numeric for the size of the standard deviation segments
- facets
a factor splitting
scoreso that subsets of the data are represented on different sub-graphics- plot
a logical indicating if the graphics is displayed
- storeData
a logical indicating if the data are stored in the returned object. If
FALSE, only the names of the data arguments are stored- add
a logical. If
TRUE, the graphic is superposed to the graphics already plotted in the current device- pos
an integer indicating the position of the environment where the data are stored, relative to the environment where the function is called. Useful only if
storeDataisFALSE- ...
additional graphical parameters (see
adegparandtrellis.par.get)
Details
Graphical parameters for rugs are available in plines of adegpar.
Some appropriated graphical parameters in p1d are also available.
The weighted means and standard deviations of class are available in the object slot stats using object@stats$means and object@stats$sds.
Value
An object of class ADEg (subclass S1.distri) or ADEgS (if add is TRUE and/or
if facets or data frame for score are used).
The result is displayed if plot is TRUE.
Author
Alice Julien-Laferriere, Aurelie Siberchicot aurelie.siberchicot@univ-lyon1.fr and Stephane Dray
Examples
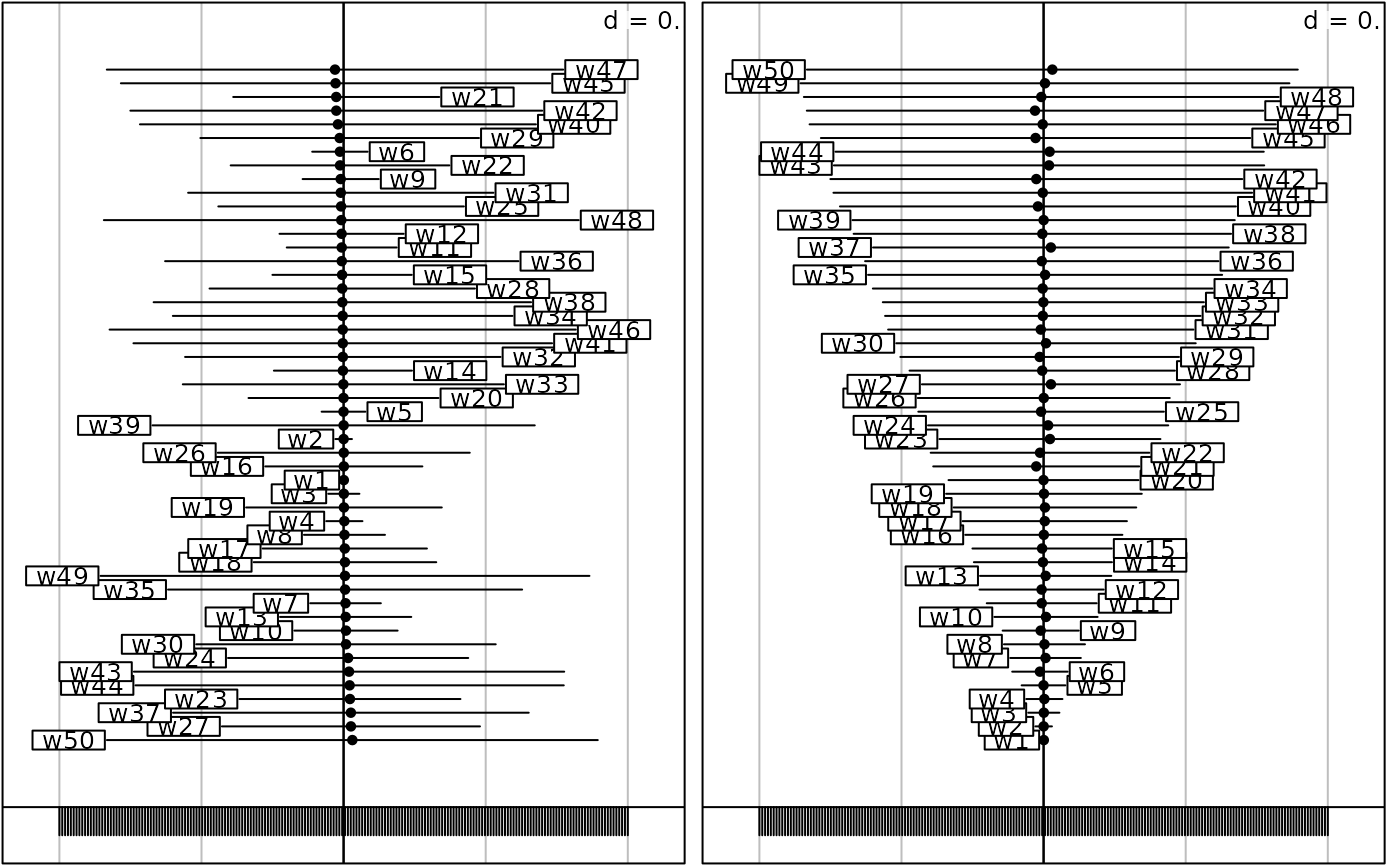
w <- seq(-1, 1, le = 200)
distri <- data.frame(lapply(1:50,
function(x) sample(200:1) * ((w >= (- x / 50)) & (w <= x / 50))))
names(distri) <- paste("w", 1:50, sep = "")
g11 <- s1d.distri(w, distri, yrank = TRUE, sdS = 1.5, plot = FALSE)
g12 <- s1d.distri(w, distri, yrank = FALSE, sdS = 1.5, plot = FALSE)
G1 <- ADEgS(c(g11, g12), layout = c(1, 2))
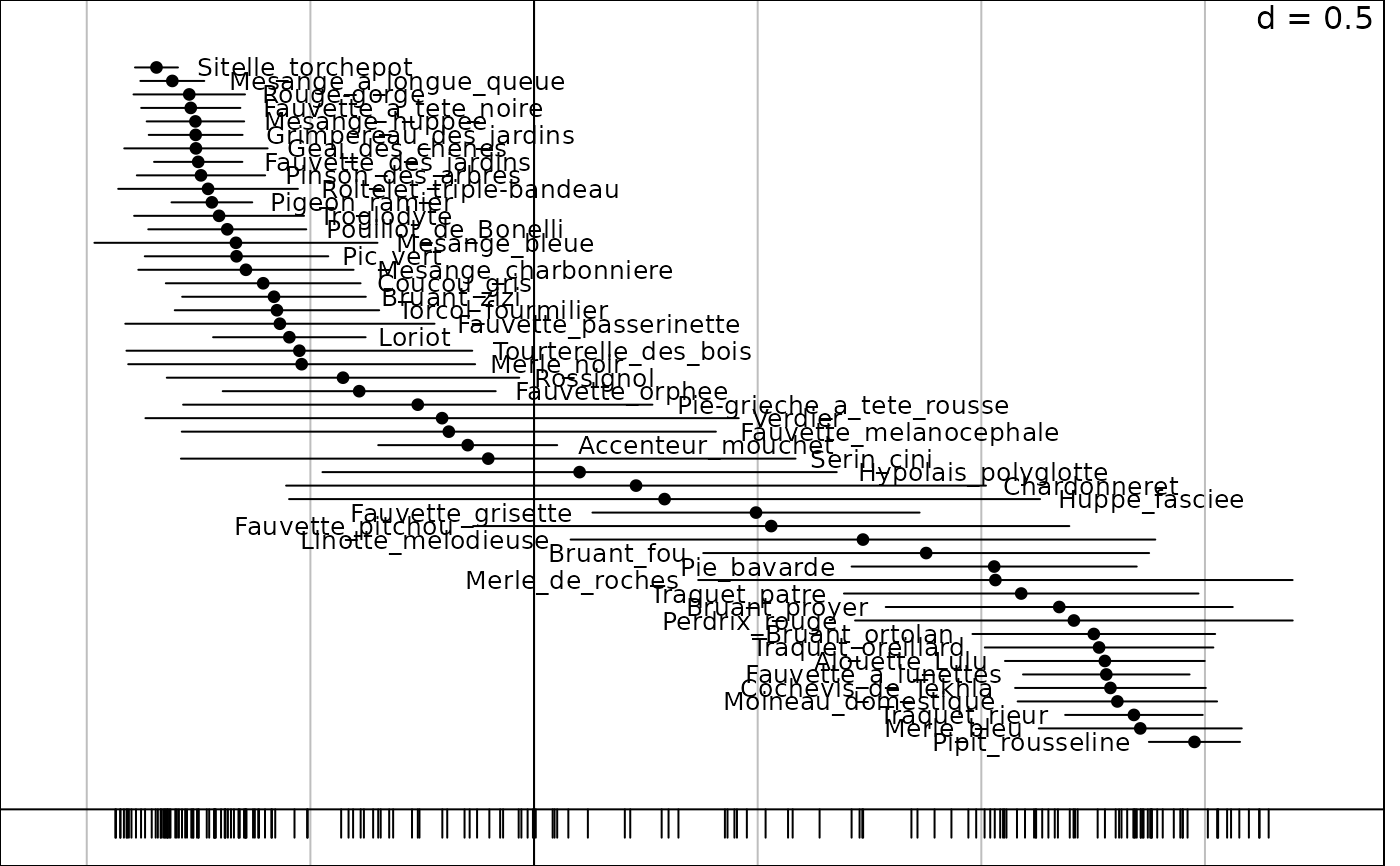
 data(rpjdl, package = "ade4")
coa1 <- ade4::dudi.coa(rpjdl$fau, scannf = FALSE)
G2 <- s1d.distri(coa1$li[,1], rpjdl$fau, labels = rpjdl$frlab,
plabels = list(cex = 0.8, boxes = list(draw = FALSE)))
data(rpjdl, package = "ade4")
coa1 <- ade4::dudi.coa(rpjdl$fau, scannf = FALSE)
G2 <- s1d.distri(coa1$li[,1], rpjdl$fau, labels = rpjdl$frlab,
plabels = list(cex = 0.8, boxes = list(draw = FALSE)))
 if (FALSE) { # \dontrun{
g31 <- s1d.distri(coa1$l1[,1], rpjdl$fau, plabels = list(cex = 0.8, boxes = list(draw = FALSE)),
plot = FALSE)
nsc1 <- ade4::dudi.nsc(rpjdl$fau, scannf = FALSE)
g32 <- s1d.distri(nsc1$l1[,1], rpjdl$fau, plabels = list(cex = 0.8, boxes = list(draw = FALSE)),
plot = FALSE)
g33 <- s.label(coa1$l1, plot = FALSE)
g34 <- s.label(nsc1$l1, plot = FALSE)
G3 <- ADEgS(c(g31, g32, g33, g34), layout = c(2, 2))
} # }
if (FALSE) { # \dontrun{
g31 <- s1d.distri(coa1$l1[,1], rpjdl$fau, plabels = list(cex = 0.8, boxes = list(draw = FALSE)),
plot = FALSE)
nsc1 <- ade4::dudi.nsc(rpjdl$fau, scannf = FALSE)
g32 <- s1d.distri(nsc1$l1[,1], rpjdl$fau, plabels = list(cex = 0.8, boxes = list(draw = FALSE)),
plot = FALSE)
g33 <- s.label(coa1$l1, plot = FALSE)
g34 <- s.label(nsc1$l1, plot = FALSE)
G3 <- ADEgS(c(g31, g32, g33, g34), layout = c(2, 2))
} # }