2-D scatter plot with labels
s.label.RdThis function represents a two dimensional scatter plot associating labels with points.
Usage
s.label(dfxy, labels = rownames(dfxy), xax = 1, yax = 2,
  facets = NULL, plot = TRUE, storeData = TRUE, add = FALSE,
  pos = -1, ...)
Arguments
- dfxy
a data frame used to produce the plot
- labels
a vector of character strings for the points' labels
- xax
an integer (or a vector) indicating which column(s) of
dfxyis(are) plotted on the x-axis- yax
an integer (or a vector) indicating which column(s) of
dfxyis(are) plotted on the y-axis- facets
a factor splitting the rows of
dfxyso that subsets of the data are represented on different sub-graphics- plot
a logical indicating if the graphics is displayed
- storeData
a logical indicating if the data should be stored in the returned object. If
FALSE, only the names of the data arguments are stored- add
a logical. If
TRUE, the graphic is superposed to the graphics already plotted in the current device- pos
an integer indicating the position of the environment where the data are stored, relative to the environment where the function is called. Useful only if
storeDataisFALSE- ...
additional graphical parameters (see
adegparandtrellis.par.get)
Value
An object of class ADEg (subclass S2.label) or ADEgS (if add is TRUE and/or
if facets or vectors for xax/yax are used).
The result is displayed if plot is TRUE.
Author
Alice Julien-Laferriere, Aurelie Siberchicot aurelie.siberchicot@univ-lyon1.fr and Stephane Dray
Examples
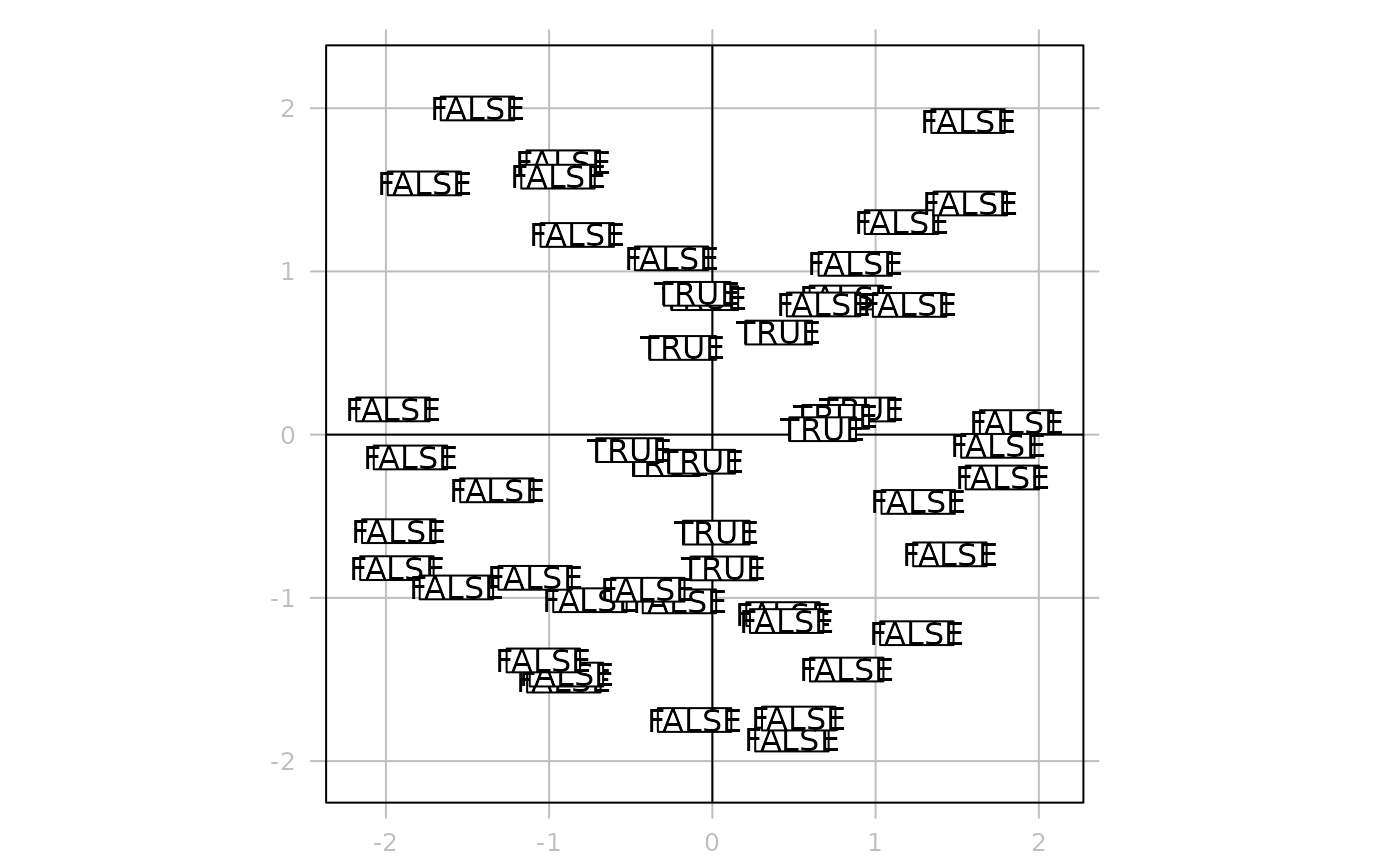
x0 <- runif(50, -2, 2)
y0 <- runif(50, -2, 2)
z <- x0 ^ 2 + y0 ^ 2
g1 <- s.label(data.frame(x0, y0), label = as.character(z < 1), paxes.draw = TRUE,
axis.text = list(col = "grey"))
 data(mafragh, package = "ade4")
g2 <- s.label(mafragh$xy, nb = mafragh$nb, paxes.draw = FALSE)
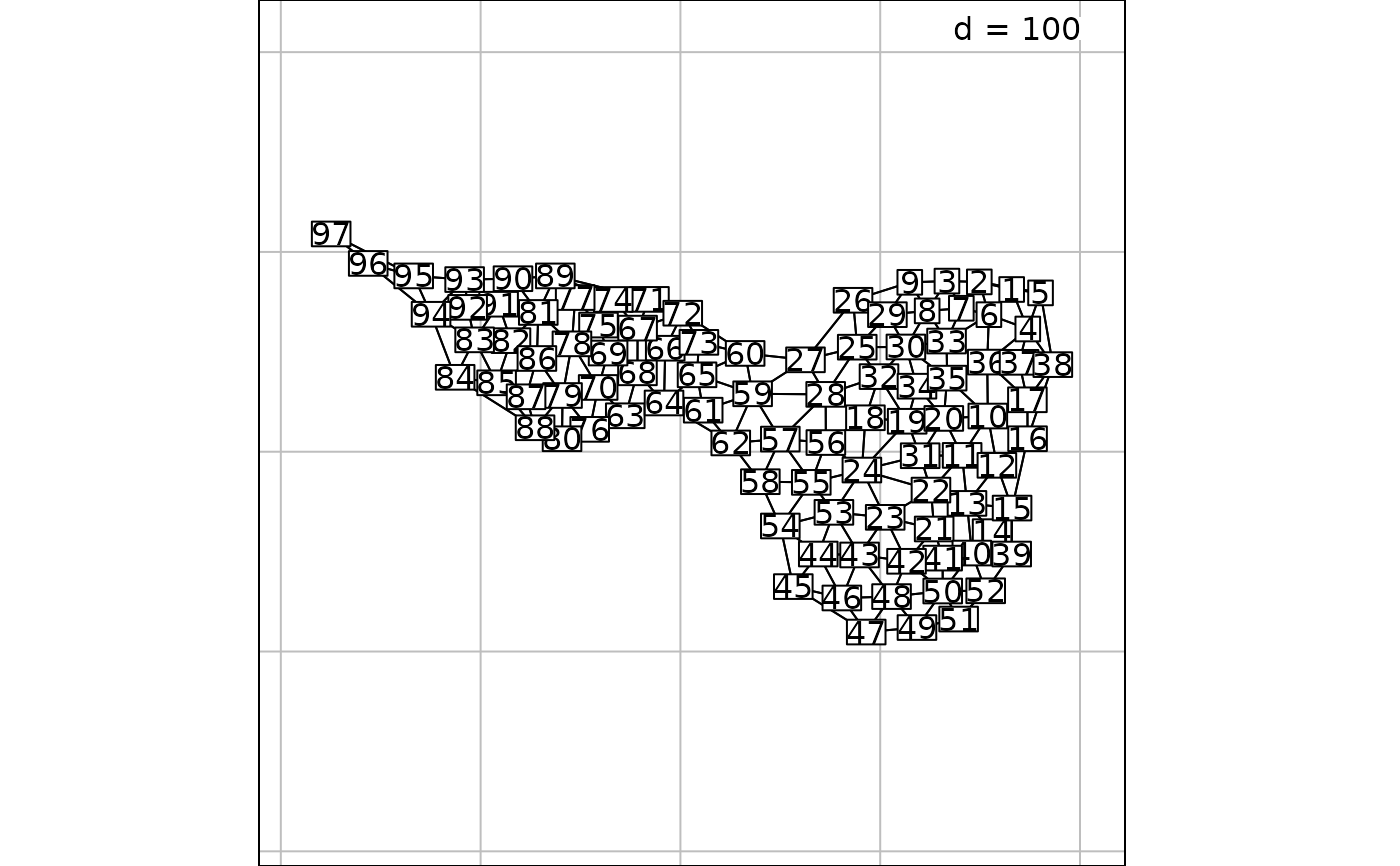
data(mafragh, package = "ade4")
g2 <- s.label(mafragh$xy, nb = mafragh$nb, paxes.draw = FALSE)
 data(irishdata, package = "ade4")
g3 <- s.label(irishdata$xy.utm, Sp = irishdata$Spatial.contour)
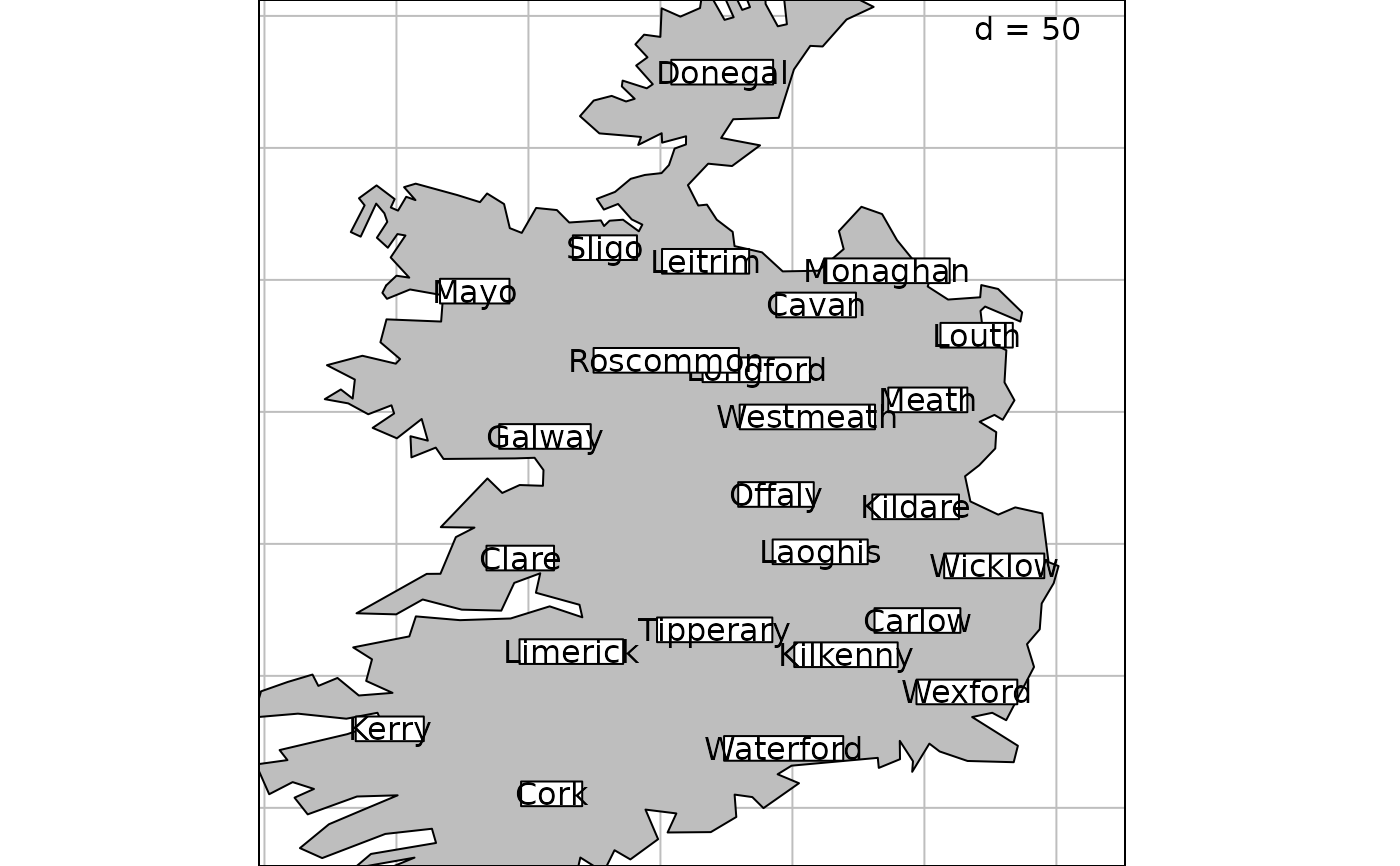
data(irishdata, package = "ade4")
g3 <- s.label(irishdata$xy.utm, Sp = irishdata$Spatial.contour)
 ## update irishdata$xy.utm call to irishdata$xy
if (FALSE) data(atlas, package = "ade4")
g4 <- s.label(atlas$xy, lab = atlas$names.district, Sp = atlas$Spatial.contour)
#> Error in s.label(atlas$xy, lab = atlas$names.district, Sp = atlas$Spatial.contour): non convenient selection for dfxy (can not be converted to dataframe)
g5 <- s.label(atlas$xy, lab = atlas$names.district, Sp = atlas$Spatial)
#> Error in s.label(atlas$xy, lab = atlas$names.district, Sp = atlas$Spatial): non convenient selection for dfxy (can not be converted to dataframe)
# \dontrun{}
## update irishdata$xy.utm call to irishdata$xy
if (FALSE) data(atlas, package = "ade4")
g4 <- s.label(atlas$xy, lab = atlas$names.district, Sp = atlas$Spatial.contour)
#> Error in s.label(atlas$xy, lab = atlas$names.district, Sp = atlas$Spatial.contour): non convenient selection for dfxy (can not be converted to dataframe)
g5 <- s.label(atlas$xy, lab = atlas$names.district, Sp = atlas$Spatial)
#> Error in s.label(atlas$xy, lab = atlas$names.district, Sp = atlas$Spatial): non convenient selection for dfxy (can not be converted to dataframe)
# \dontrun{}