2-D scatter plot with arrows
s.arrow.RdThis function represents a two dimensional scatter plot with arrows linking points to the origin.
Usage
s.arrow(dfxy, xax = 1, yax = 2, labels = row.names(as.data.frame(dfxy)),
  facets = NULL, plot = TRUE, storeData = TRUE, add = FALSE, pos = -1, ...)
Arguments
- dfxy
a data frame used to produce the plot
- xax
an integer (or a vector) indicating which column(s) of
dfxyis(are) plotted on the x-axis- yax
an integer (or a vector) indicating which column(s) of
dfxyis(are) plotted on the y-axis- labels
a character vector containing labels for arrows
- facets
a factor splitting the rows of
dfxyso that subsets of the data are represented on different sub-graphics- plot
a logical indicating if the graphics is displayed
- storeData
a logical indicating if the data are stored in the returned object. If
FALSE, only the names of the data arguments are stored- add
a logical. If
TRUE, the graphic is superposed to the graphics already plotted in the current device- pos
an integer indicating the position of the environment where the data are stored, relative to the environment where the function is called. Useful only if
storeDataisFALSE- ...
additional graphical parameters (see
adegparandtrellis.par.get)
Details
An other origin for arrows can be specified using an adegpar parameters: porigin.
Graphical parameters for points and arrows are available in parrows and ppoints of adegpar.
Value
An object of class ADEg (subclass S2.arrow) or ADEgS (if add is TRUE and/or
if facets or vectors for xax/yax are used).
The result is displayed if plot is TRUE.
Author
Alice Julien-Laferriere, Aurelie Siberchicot aurelie.siberchicot@univ-lyon1.fr and Stephane Dray
Examples
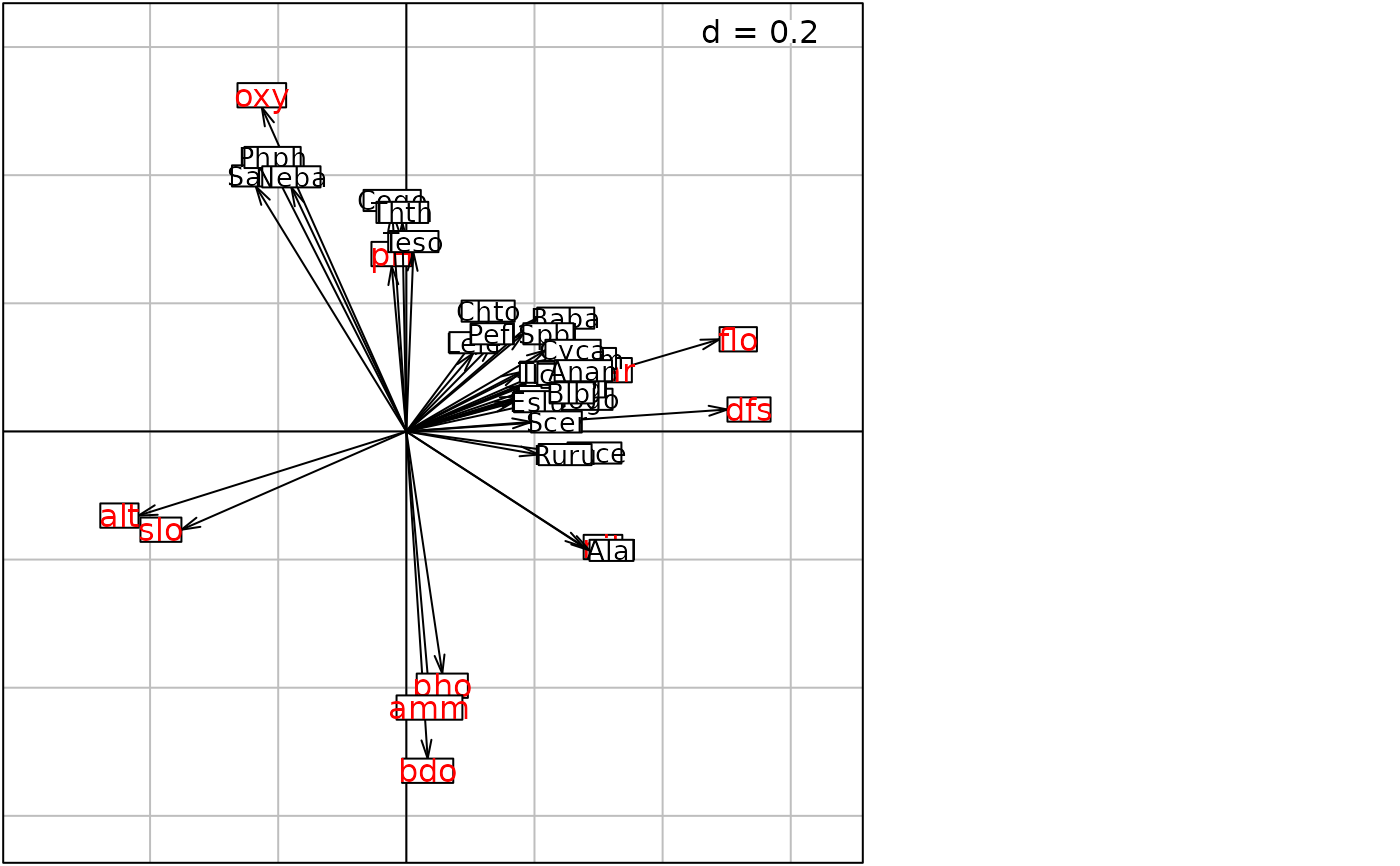
data(doubs, package = "ade4")
dudi1 <- ade4::dudi.pca(doubs$env, scale = TRUE, scannf = FALSE, nf = 3)
dudi2 <- ade4::dudi.pca(doubs$fish, scale = TRUE, scannf = FALSE, nf = 2)
coin1 <- ade4::coinertia(dudi1, dudi2, scannf = FALSE, nf = 2)
g11 <- s.arrow(coin1$l1, plabels.cex = 0.87, plot = FALSE)
g12 <- s.arrow(coin1$c1, plabels.cex = 1, plabels.col = "red", plot = FALSE)
g1 <- superpose(g12, g11, plot = TRUE)
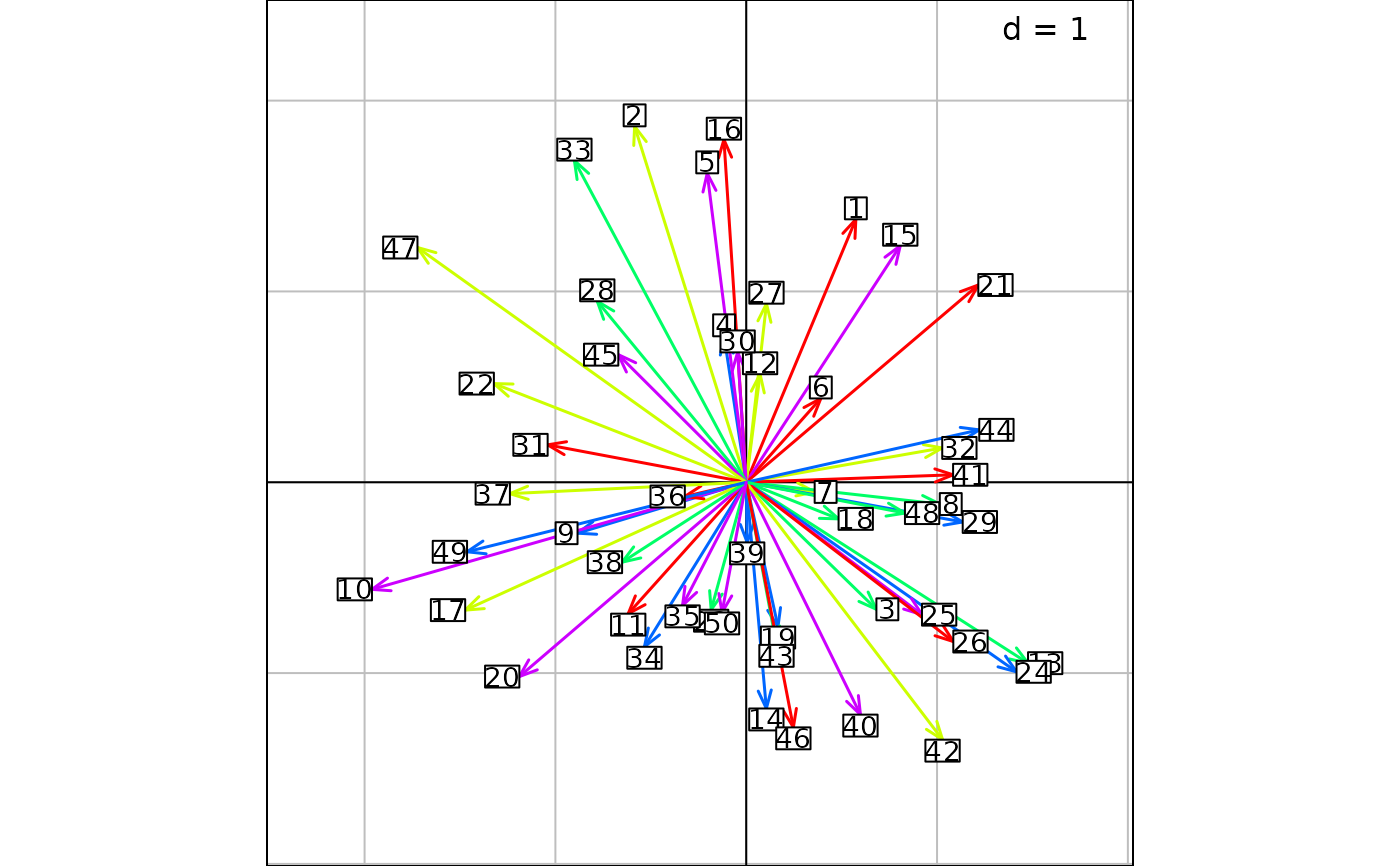
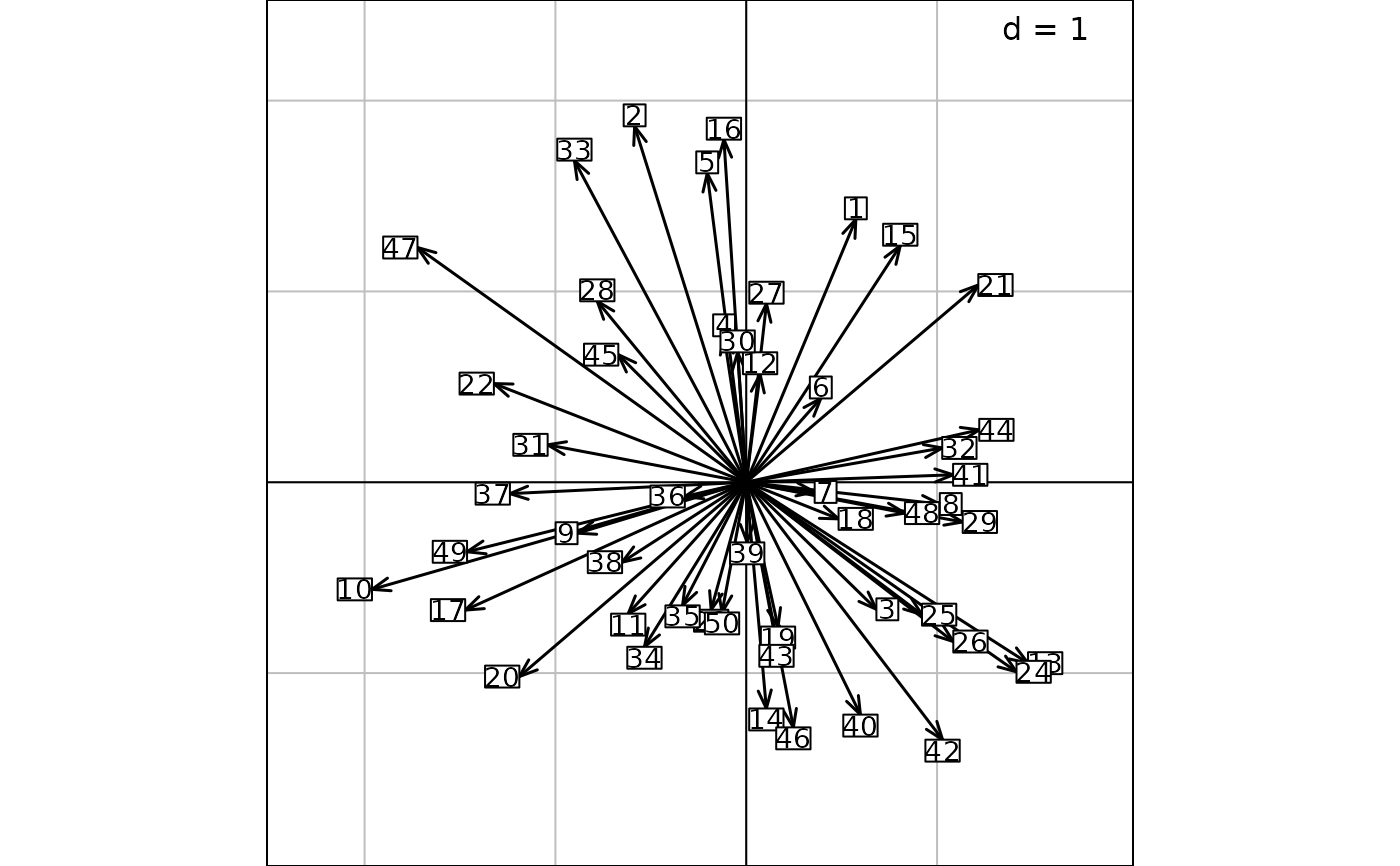
 xy <- cbind(rnorm(50), rnorm(50))
g2 <- s.arrow(xy, plabels.cex = 0.9, plines = list(lwd = 1.5), parrows.angle = 20)
xy <- cbind(rnorm(50), rnorm(50))
g2 <- s.arrow(xy, plabels.cex = 0.9, plines = list(lwd = 1.5), parrows.angle = 20)
 update(g2, plines = list(col = rainbow(5)))