Coinertia Analysis
coinertia.RdThe coinertia analysis performs a double inertia analysis of two tables.
Arguments
- dudiX
a duality diagram providing from one of the functions dudi.coa, dudi.pca, ...
- dudiY
a duality diagram providing from one of the functions dudi.coa, dudi.pca, ...
- scannf
a logical value indicating whether the eigenvalues bar plot should be displayed
- nf
if scannf FALSE, an integer indicating the number of kept axes
Value
Returns a list of class 'coinertia', sub-class 'dudi' containing:
- call
call
- rank
rank
- nf
a numeric value indicating the number of kept axes
- RV
a numeric value, the RV coefficient
- eig
a numeric vector with all the eigenvalues
- lw
a numeric vector with the rows weigths (crossed table)
- cw
a numeric vector with the columns weigths (crossed table)
- tab
a crossed table (CT)
- li
CT row scores (cols of dudiY)
- l1
Principal components (loadings for cols of dudiY)
- co
CT col scores (cols of dudiX)
- c1
Principal axes (cols of dudiX)
- lX
Row scores (rows of dudiX)
- mX
Normed row scores (rows of dudiX)
- lY
Row scores (rows of dudiY)
- mY
Normed row scores (rows of dudiY)
- aX
Correlations between dudiX axes and coinertia axes
- aY
Correlations between dudiY axes and coinertia axes
References
Dolédec, S. and Chessel, D. (1994) Co-inertia analysis: an alternative method for studying species-environment relationships.
Freshwater Biology, 31, 277–294.
Dray, S., Chessel, D. and J. Thioulouse (2003) Co-inertia analysis and the linking of the ecological data tables. Ecology, 84, 11, 3078–3089.
Author
Daniel Chessel
Anne-Béatrice Dufour anne-beatrice.dufour@univ-lyon1.fr
Examples
data(doubs)
dudi1 <- dudi.pca(doubs$env, scale = TRUE, scan = FALSE, nf = 3)
dudi2 <- dudi.pca(doubs$fish, scale = FALSE, scan = FALSE, nf = 2)
coin1 <- coinertia(dudi1,dudi2, scan = FALSE, nf = 2)
coin1
#> Coinertia analysis
#> call: coinertia(dudiX = dudi1, dudiY = dudi2, scannf = FALSE, nf = 2)
#> class: coinertia dudi
#>
#> $rank (rank)     : 11
#> $nf (axis saved) : 2
#> $RV (RV coeff)   : 0.4505569
#>
#> eigenvalues: 119 13.87 0.7566 0.5278 0.2709 ...
#>
#>   vector length mode    content
#> 1 $eig   11     numeric Eigenvalues
#> 2 $lw    27     numeric Row weigths (for dudi2 cols)
#> 3 $cw    11     numeric Col weigths (for dudi1 cols)
#>
#>    data.frame nrow ncol content
#> 1  $tab       27   11   Crossed Table (CT): cols(dudi2) x cols(dudi1)
#> 2  $li        27   2    CT row scores (cols of dudi2)
#> 3  $l1        27   2    Principal components (loadings for dudi2 cols)
#> 4  $co        11   2    CT col scores (cols of dudi1)
#> 5  $c1        11   2    Principal axes (loadings for dudi1 cols)
#> 6  $lX        30   2    Row scores (rows of dudi1)
#> 7  $mX        30   2    Normed row scores (rows of dudi1)
#> 8  $lY        30   2    Row scores (rows of dudi2)
#> 9  $mY        30   2    Normed row scores (rows of dudi2)
#> 10 $aX        3    2    Corr dudi1 axes / coinertia axes
#> 11 $aY        2    2    Corr dudi2 axes / coinertia axes
#>
#> CT rows = cols of dudi2 (27) / CT cols = cols of dudi1 (11)
summary(coin1)
#> Coinertia analysis
#>
#> Class: coinertia dudi
#> Call: coinertia(dudiX = dudi1, dudiY = dudi2, scannf = FALSE, nf = 2)
#>
#> Total inertia: 134.7
#>
#> Eigenvalues:
#>      Ax1      Ax2      Ax3      Ax4      Ax5
#> 119.0194  13.8714   0.7566   0.5278   0.2709
#>
#> Projected inertia (%):
#>     Ax1     Ax2     Ax3     Ax4     Ax5
#> 88.3570 10.2978  0.5617  0.3918  0.2011
#>
#> Cumulative projected inertia (%):
#>     Ax1   Ax1:2   Ax1:3   Ax1:4   Ax1:5
#>   88.36   98.65   99.22   99.61   99.81
#>
#> (Only 5 dimensions (out of 11) are shown)
#>
#> Eigenvalues decomposition:
#>         eig     covar      sdX      sdY      corr
#> 1 119.01942 10.909602 2.326324 6.422570 0.7301798
#> 2  13.87137  3.724429 1.685078 2.863743 0.7718017
#>
#> Inertia & coinertia X (dudi1):
#>     inertia      max     ratio
#> 1  5.411785 6.321624 0.8560752
#> 12 8.251272 8.553220 0.9646978
#>
#> Inertia & coinertia Y (dudi2):
#>     inertia      max     ratio
#> 1  41.24940 42.74627 0.9649824
#> 12 49.45042 50.90461 0.9714331
#>
#> RV:
#>  0.4505569

if(adegraphicsLoaded()) {
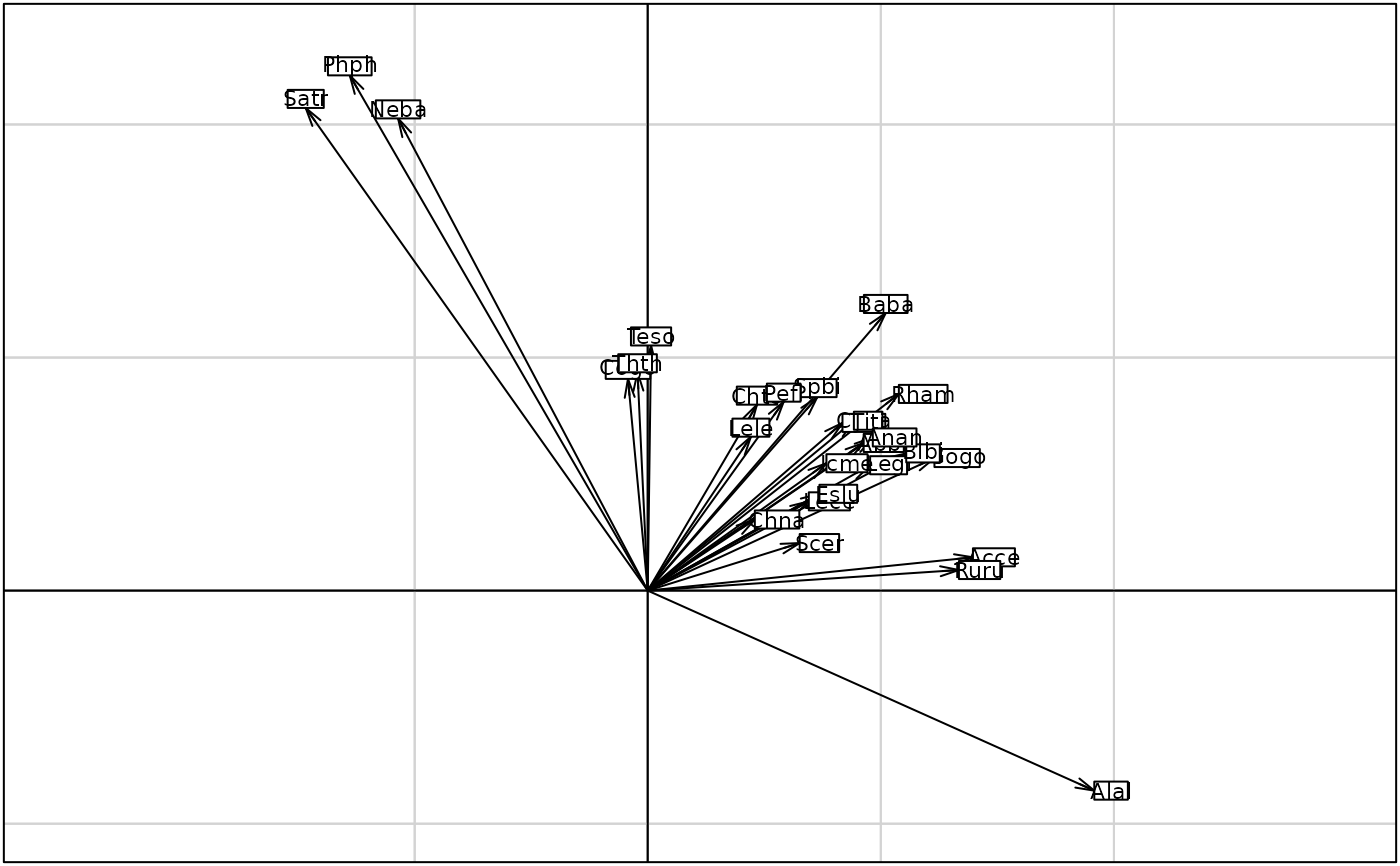
  g1 <- s.arrow(coin1$l1, plab.cex = 0.7)
  g2 <- s.arrow(coin1$c1, plab.cex = 0.7)
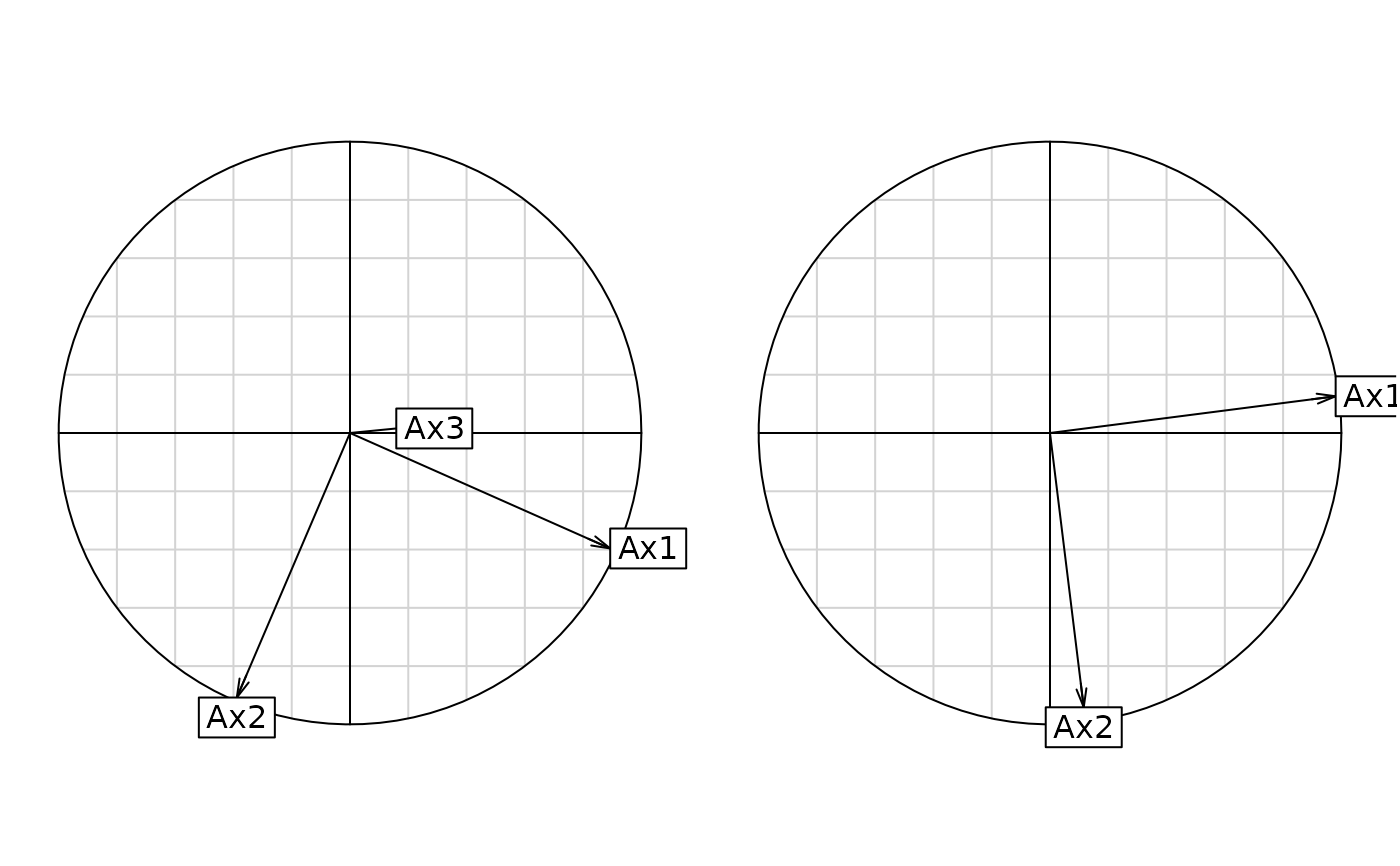
  g3 <- s.corcircle(coin1$aX, plot = FALSE)
  g4 <- s.corcircle(coin1$aY, plot = FALSE)
  cbindADEg(g3, g4, plot = TRUE)
  g5 <- plot(coin1)

} else {
s.arrow(coin1$l1, clab = 0.7)
s.arrow(coin1$c1, clab = 0.7)
par(mfrow = c(1,2))
s.corcircle(coin1$aX)
s.corcircle(coin1$aY)
par(mfrow = c(1,1))
plot(coin1)
}


#> Error in s.corcircle(dfxy = coin1$aX, xax = 1, yax = 2, plot = FALSE,     storeData = TRUE, pos = -3, psub = list(text = "Unconstrained axes (X)"),     pbackground = list(box = FALSE), plabels = list(cex = 1.25)): non convenient selection for dfxy (can not be converted to dataframe)