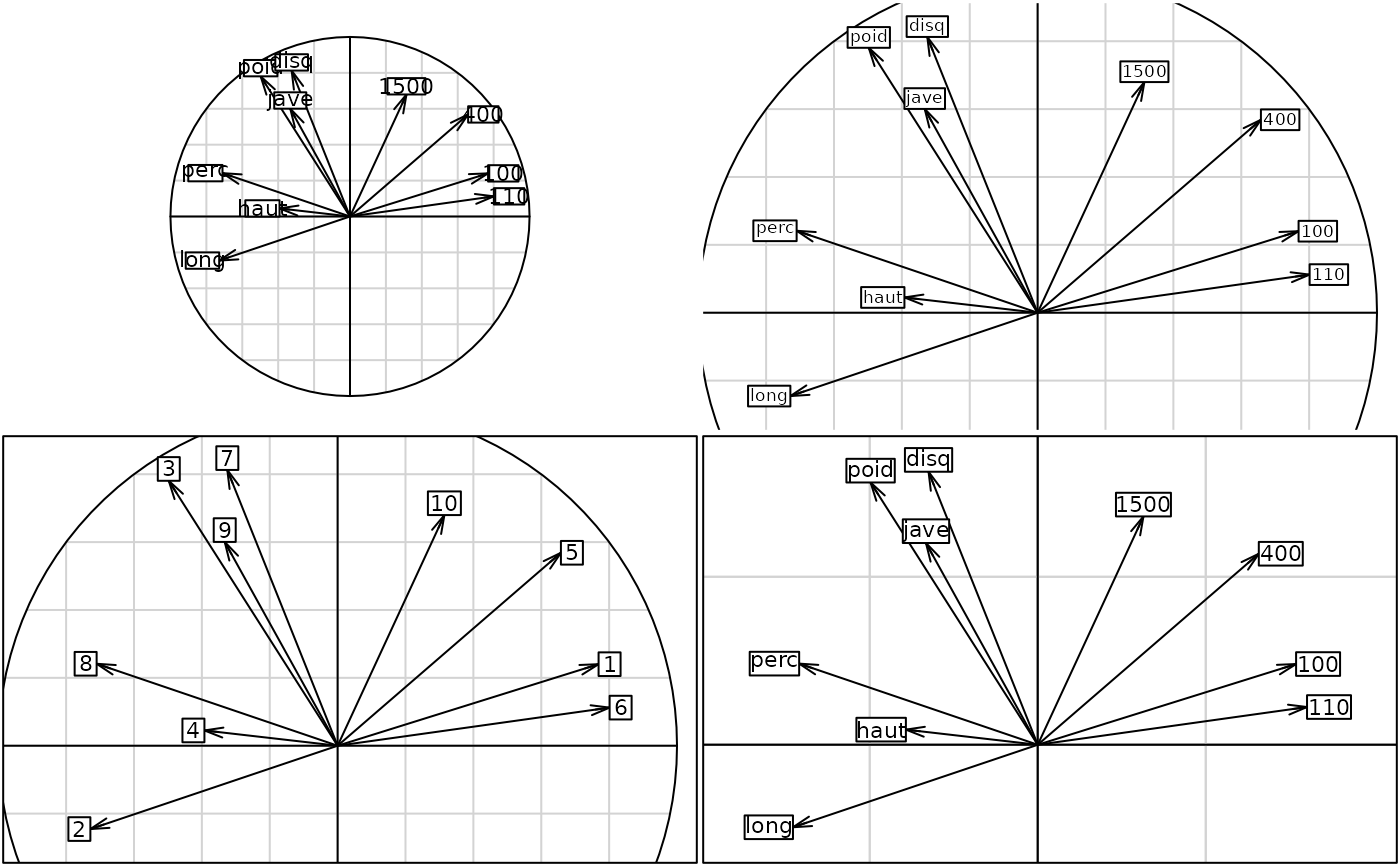
Plot of the factorial maps of a correlation circle
s.corcircle.Rdperforms the scatter diagram of a correlation circle.
Usage
s.corcircle(dfxy, xax = 1, yax = 2, label = row.names(df),
    clabel = 1, grid = TRUE, sub = "", csub = 1, possub = "bottomleft",
    cgrid = 0, fullcircle = TRUE, box = FALSE, add.plot = FALSE)
Arguments
- dfxy
a data frame with two coordinates
- xax
the column number for the x-axis
- yax
the column number for the y-axis
- label
a vector of strings of characters for the point labels
- clabel
if not NULL, a character size for the labels, used with
par("cex")*clabel- grid
a logical value indicating whether a grid in the background of the plot should be drawn
- sub
a string of characters to be inserted as legend
- csub
a character size for the legend, used with
par("cex")*csub- possub
a string of characters indicating the sub-title position ("topleft", "topright", "bottomleft", "bottomright")
- cgrid
a character size, parameter used with par("cex")*
cgridto indicate the mesh of the grid- fullcircle
a logical value indicating whether the complete circle sould be drawn
- box
a logical value indcating whether a box should be drawn
- add.plot
if TRUE uses the current graphics window
Examples
if(!adegraphicsLoaded()) {
  data (olympic)
  dudi1 <- dudi.pca(olympic$tab, scan = FALSE) # a normed PCA
  par(mfrow = c(2, 2))
  s.corcircle(dudi1$co, lab = names(olympic$tab))
  s.corcircle(dudi1$co, cgrid = 0, full = FALSE, clab = 0.8)
  s.corcircle(dudi1$co, lab = as.character(1:11), cgrid = 2,
    full = FALSE, sub = "Correlation circle", csub = 2.5,
    possub = "bottomleft", box = TRUE)
  s.arrow(dudi1$co, clab = 1)
  par(mfrow = c(1, 1))
}
