Plot a barchart of eigen values
plotEig.RdThis function represents a simplified barchart adapted to display eigen values. The bar color depends on whether the axis is displayed, kept or not.
Usage
plotEig(eigvalue, nf, xax = 1, yax = 2, col.plot = "black", col.kept = "grey",
  col = "white", facets = NULL, plot = TRUE, storeData = FALSE, pos = -1, ...)
Arguments
- eigvalue
a numeric vector of eigenvalues
- nf
the number of retained factors, NULL if not provided
- xax
an integer indicating which factor is plotted on the x-axis
- yax
an integer indicating which factor is plotted on the y-axis
- col.plot
a color value to fill the bar corresponding to the displayed factors
- col.kept
a color value to fill the bar corresponding to the kept by not displayed factors
- col
a color value to fill the bar corresponding to the other factors
- facets
a factor splitting the rows of
dfxyso that subsets of the data are represented on different sub-graphics- plot
a logical indicating if the graphics is displayed
- storeData
a logical indicating if the data should be stored in the returned object. If
FALSE, only the names of the data arguments are stored- pos
an integer indicating the position of the environment where the data are stored, relative to the environment where the function is called. Useful only if
storeDataisFALSE- ...
additional graphical parameters (see
adegparandtrellis.par.get)
Details
Graphical parameters for bars are available in ppolygons of adegpar.
Some appropriated graphical parameters in p1d are also available.
Author
Alice Julien-Laferriere, Aurelie Siberchicot aurelie.siberchicot@univ-lyon1.fr and Stephane Dray
Examples
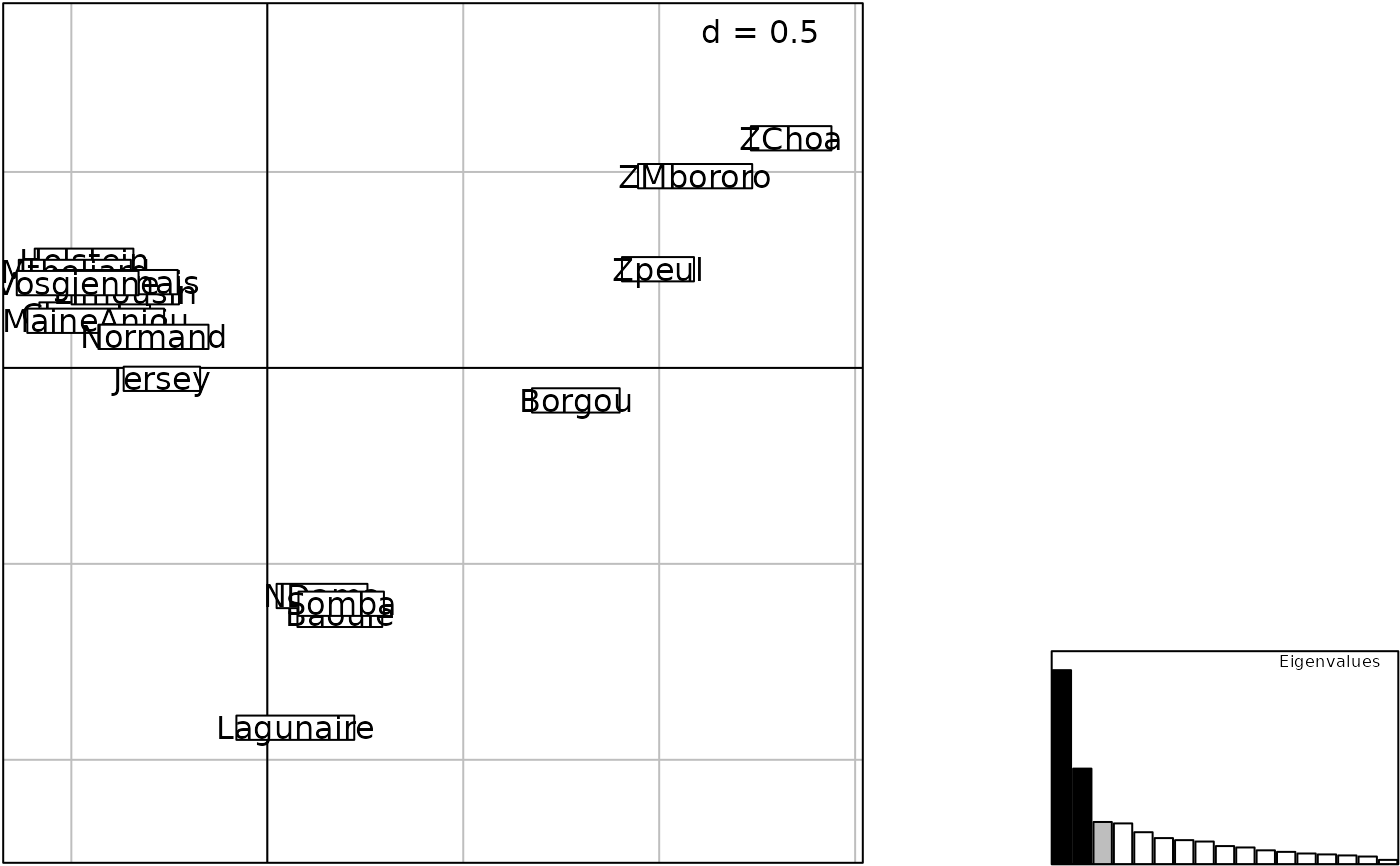
  data(microsatt, package = "ade4")
  w <- ade4::dudi.coa(data.frame(t(microsatt$tab)), scann = FALSE, nf = 3)
  g1 <- s.label(w$co, plot = FALSE)
  g2 <- plotEig(w$eig, w$nf, psub = list(text = "Eigenvalues"), pbackground = list(box = TRUE),
    plot = FALSE)
  G <- insert(g2, g1, posi = "bottomright", ratio = 0.25)