Superpose an new ADEg graph to the previous ones plotted
add.ADEg.RdAdds an ADEg to the current ADEg or ADEgS plot.
Details
This function uses the last plotted ADEg or ADEgS object.
It calls superpose.
Author
Alice Julien-Laferriere, Aurelie Siberchicot aurelie.siberchicot@univ-lyon1.fr and Stephane Dray
Examples
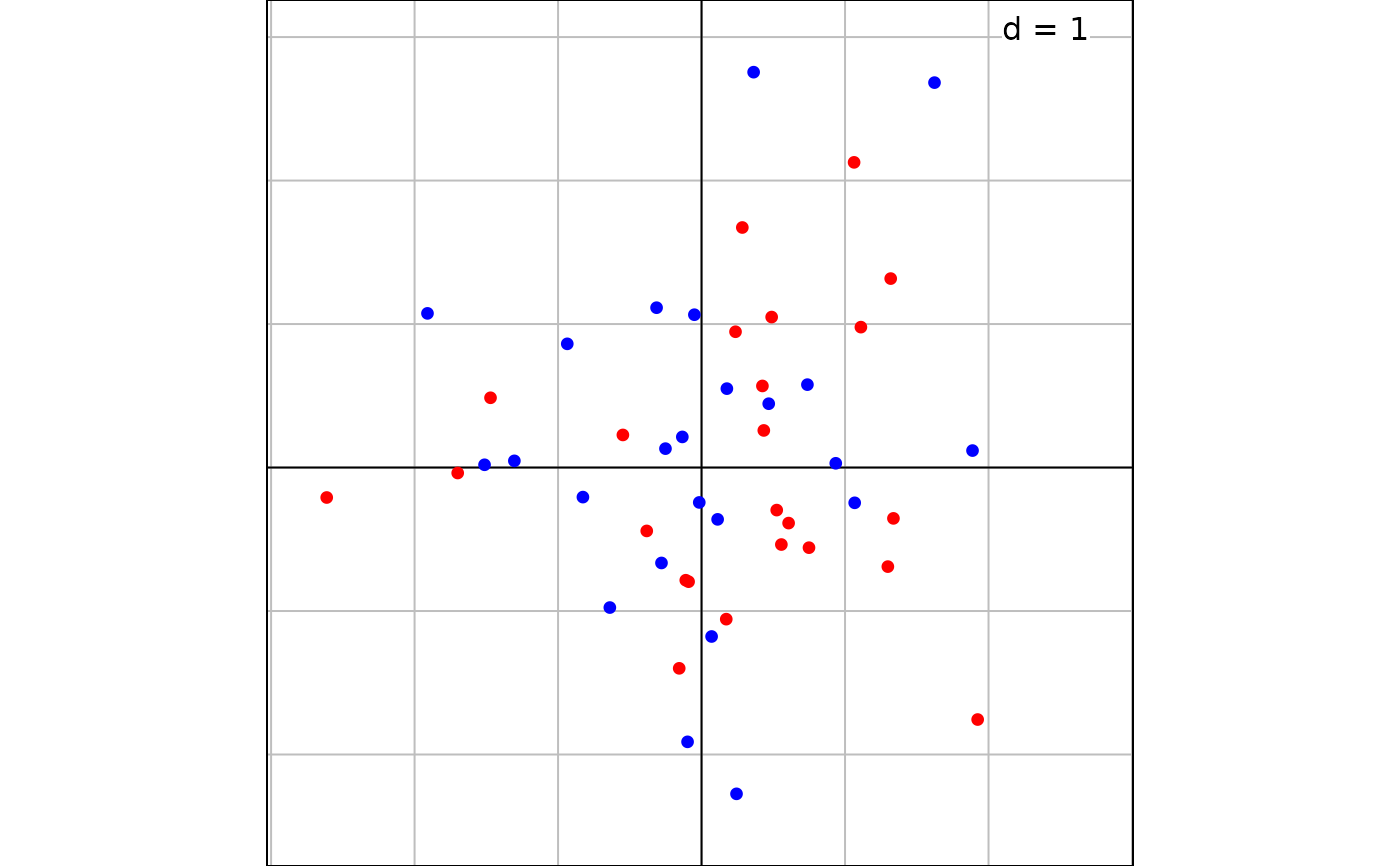
df1 <- cbind(rnorm(24), rnorm(24))
df2 <- cbind(rnorm(24), rnorm(24))
g1 <- s.label(df1, ppoints.col = "blue")
g2 <- s.label(df2, ppoints.col = "red", plot = FALSE)
add.ADEg(g2)
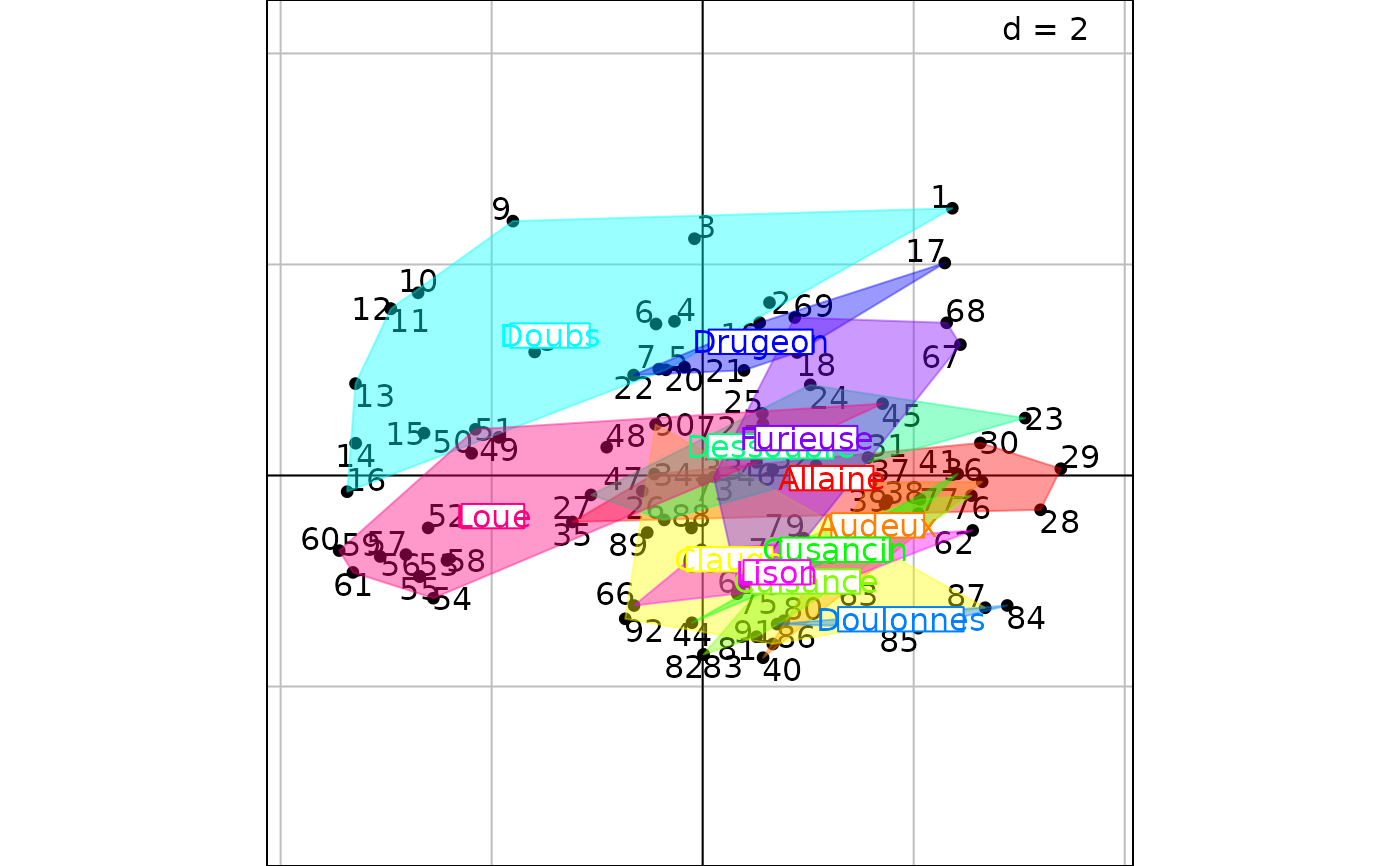
 data(jv73, package = "ade4")
pca1 <- ade4::dudi.pca(jv73$morpho, scannf = FALSE)
g5 <- s.label(pca1$li, plabels.optim = TRUE)
g6 <- s.class(pca1$li, jv73$fac.riv, starSize = 0, ellipseSize = 0, chullSize = 1,
ppolygons.alpha = 0.4, col = rainbow(12), ppoints.cex = 0, plot = FALSE)
add.ADEg(g6)
data(jv73, package = "ade4")
pca1 <- ade4::dudi.pca(jv73$morpho, scannf = FALSE)
g5 <- s.label(pca1$li, plabels.optim = TRUE)
g6 <- s.class(pca1$li, jv73$fac.riv, starSize = 0, ellipseSize = 0, chullSize = 1,
ppolygons.alpha = 0.4, col = rainbow(12), ppoints.cex = 0, plot = FALSE)
add.ADEg(g6)