2-D scatter plot with a partition in classes (levels of a factor)
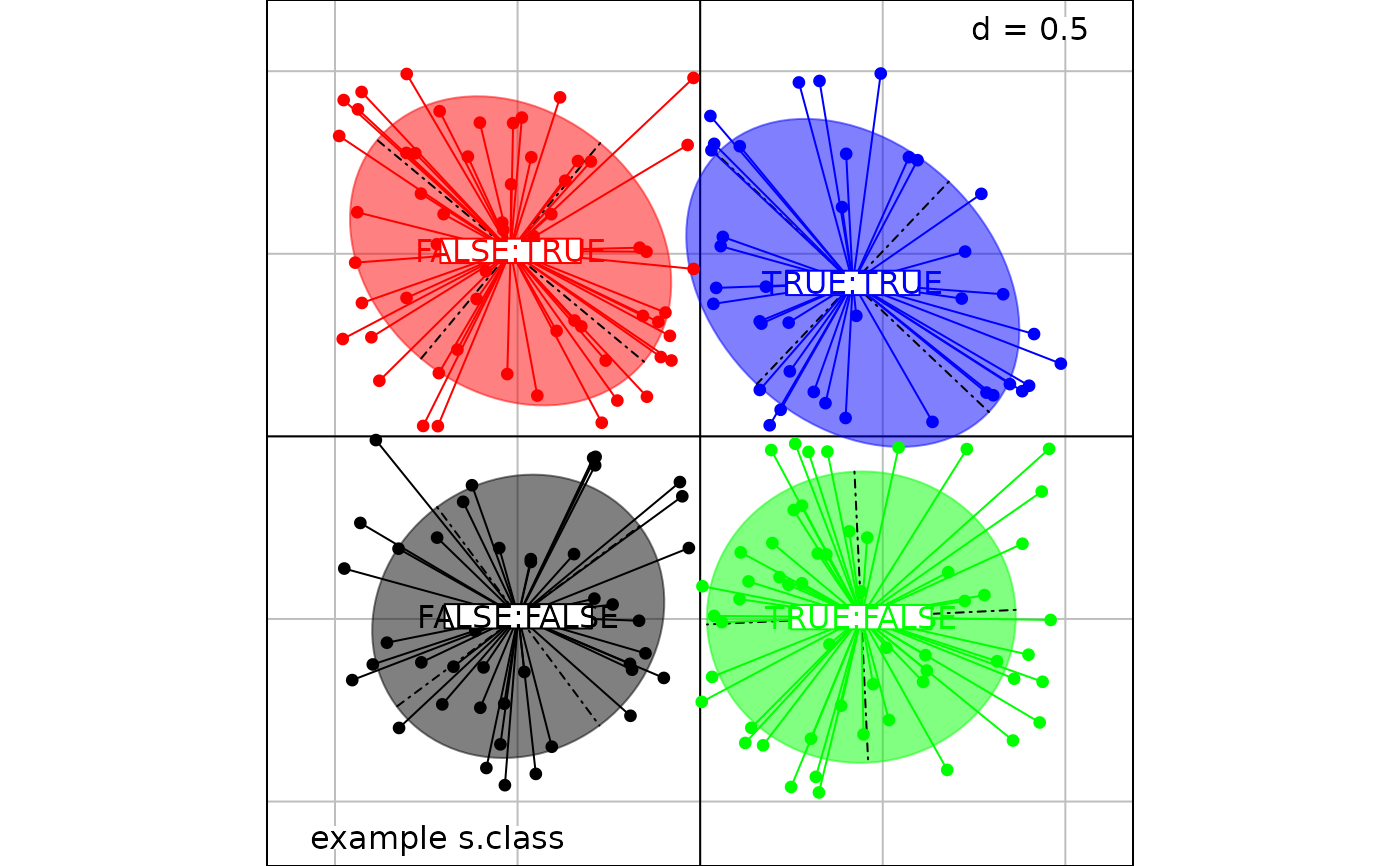
s.class.RdThis function represents a two dimensional scatter plot grouping points to the same class. Classes are represented by ellipses, stars and/or convex hulls.
Arguments
- dfxy
a data frame used to produce the plot
- fac
a factor (or a matrix of factors) splitting the rows of
dfxy- xax
an integer (or a vector) indicating which column(s) of
dfxyis(are) plotted on the x-axis- yax
an integer (or a vector) indicating which column(s) of
dfxyis(are) plotted on the y-axis- wt
a vector of weights for
fac- labels
a character vector containing the class' labels
- ellipseSize
a positive number for ellipse size
- starSize
a number between 0 and 1 for the size of the stars segments joining the stars' center (centroids) and the matching points
- chullSize
NULLor a vector of numbers between 0 and 1 for the fraction of points included in the convex hull- col
a color or a colors vector to color points, ellipses, labels, lines and polygons
- facets
a factor splitting the rows of
dfxyso that subsets of the data are represented on different sub-graphics- plot
a logical indicating if the graphics is displayed
- storeData
a logical indicating if the data should be stored in the returned object. If
FALSE, only the names of the data arguments are stored- add
a logical. If
TRUE, the graphic is superposed to the graphics already plotted in the current device- pos
an integer indicating the position of the environment where the data are stored, relative to the environment where the function is called. Useful only if
storeDataisFALSE- ...
additional graphical parameters (see
adegparandtrellis.par.get)
Details
Graphical parameters for ellipses, stars and convex hulls are available in pellipses, plines and ppolygons of adegpar.
Value
An object of class ADEg (subclass S2.class) or ADEgS (if add is TRUE and/or
if facets or multidimensional fac or vectors for xax/yax are used).
The result is displayed if plot is TRUE.
Author
Alice Julien-Laferriere, Aurelie Siberchicot aurelie.siberchicot@univ-lyon1.fr and Stephane Dray
Examples
xy <- cbind.data.frame(x = runif(200, -1, 1), y = runif(200, -1, 1))
posi <- factor(xy$x > 0) : factor(xy$y > 0)
coul <- c("black", "red", "green", "blue")
s.class(xy, fac = posi, col = coul, psub.text = "example s.class", pellipses.col = coul)
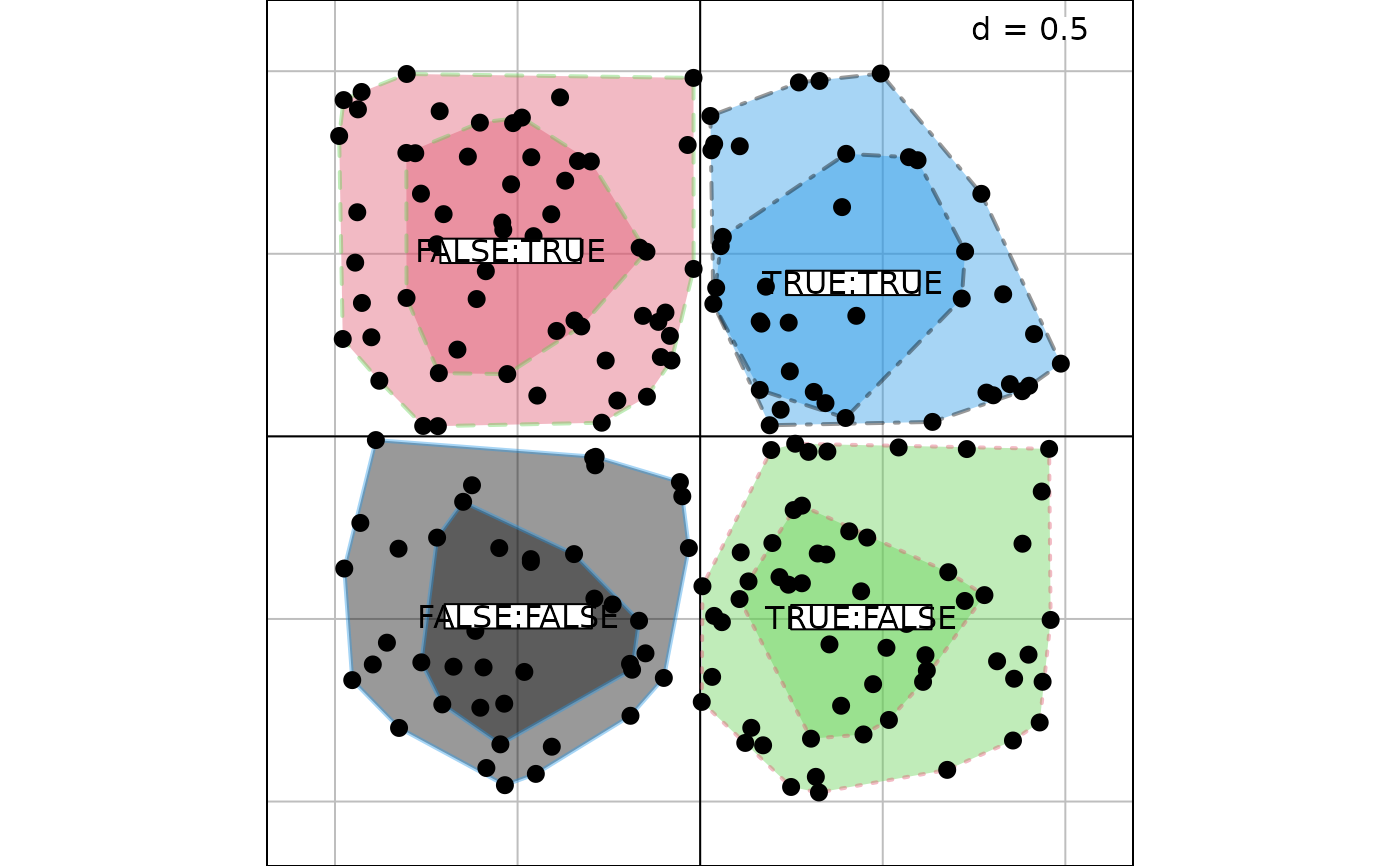
 s.class(xy, fac = posi, ppoints.cex = 1.5, ellipseSize = 0, starSize = 0,
ppolygons = list(border = 4:1, col = 1:4, lty = 1:4, lwd = 2, alpha = 0.4),
chullSize = c(1, 0.5))
s.class(xy, fac = posi, ppoints.cex = 1.5, ellipseSize = 0, starSize = 0,
ppolygons = list(border = 4:1, col = 1:4, lty = 1:4, lwd = 2, alpha = 0.4),
chullSize = c(1, 0.5))
 s.class(xy, fac = posi, facets = posi, ppoints.cex = 1.5, ellipseSize = 0, starSize = 0,
ppolygons = list(border = 4:1, col = 1:4, lty = 1:4, lwd = 2, alpha = 0.4),
chullSize = c(1, 0.5))
#> Error in multi.facets.S2(thecall, sortparameters$adepar, samelimits = sortparameters$g.args$samelimits): object 'xy' not found
if (FALSE) { # \dontrun{
s.class(xy, fac = posi, col = coul, psub.text = "example s.class", pellipses.col = coul,
plabels.cex = 0, key = list(space = "left"))
data(banque, package = "ade4")
dudi1 <- ade4::dudi.acm(banque, scannf = FALSE)
col <- rainbow(length(levels(banque[, 20])))
g1 <- s.label(dudi1$li, psub = list(text = "Factorial map from ACM", cex = 1.5,
position = "topleft"), plot = FALSE)
g2 <- s.class(dudi1$li, banque[, 20], psub = list(text = names(banque)[20], cex = 1.5,
position = "bottomright"), ellipseSize = 0, starSize = 0.5, pgrid.text.cex = 0, plot = FALSE)
g3 <- s.class(dudi1$li, banque[, 20], starSize = 0, ellipseSize = 2, pgrid.text.cex = 0,
plabels.cex = 1.5, plot = FALSE)
g4 <- s.class(dudi1$li, banque[, 20], psub = list(text = names(banque)[20],
position = "topright"), pgrid.text.cex = 0, col = col, pellipses.lwd = 1.5, plot = FALSE)
G1 <- ADEgS(c(g1, g2, g3, g4), layout = c(2, 2))
G2 <- s.class(dudi1$li, banque, psub = list(position = "topleft"), pgrid.text.cex = 0,
starSize = 0, ppoints.cex = 0)
} # }
s.class(xy, fac = posi, facets = posi, ppoints.cex = 1.5, ellipseSize = 0, starSize = 0,
ppolygons = list(border = 4:1, col = 1:4, lty = 1:4, lwd = 2, alpha = 0.4),
chullSize = c(1, 0.5))
#> Error in multi.facets.S2(thecall, sortparameters$adepar, samelimits = sortparameters$g.args$samelimits): object 'xy' not found
if (FALSE) { # \dontrun{
s.class(xy, fac = posi, col = coul, psub.text = "example s.class", pellipses.col = coul,
plabels.cex = 0, key = list(space = "left"))
data(banque, package = "ade4")
dudi1 <- ade4::dudi.acm(banque, scannf = FALSE)
col <- rainbow(length(levels(banque[, 20])))
g1 <- s.label(dudi1$li, psub = list(text = "Factorial map from ACM", cex = 1.5,
position = "topleft"), plot = FALSE)
g2 <- s.class(dudi1$li, banque[, 20], psub = list(text = names(banque)[20], cex = 1.5,
position = "bottomright"), ellipseSize = 0, starSize = 0.5, pgrid.text.cex = 0, plot = FALSE)
g3 <- s.class(dudi1$li, banque[, 20], starSize = 0, ellipseSize = 2, pgrid.text.cex = 0,
plabels.cex = 1.5, plot = FALSE)
g4 <- s.class(dudi1$li, banque[, 20], psub = list(text = names(banque)[20],
position = "topright"), pgrid.text.cex = 0, col = col, pellipses.lwd = 1.5, plot = FALSE)
G1 <- ADEgS(c(g1, g2, g3, g4), layout = c(2, 2))
G2 <- s.class(dudi1$li, banque, psub = list(position = "topleft"), pgrid.text.cex = 0,
starSize = 0, ppoints.cex = 0)
} # }