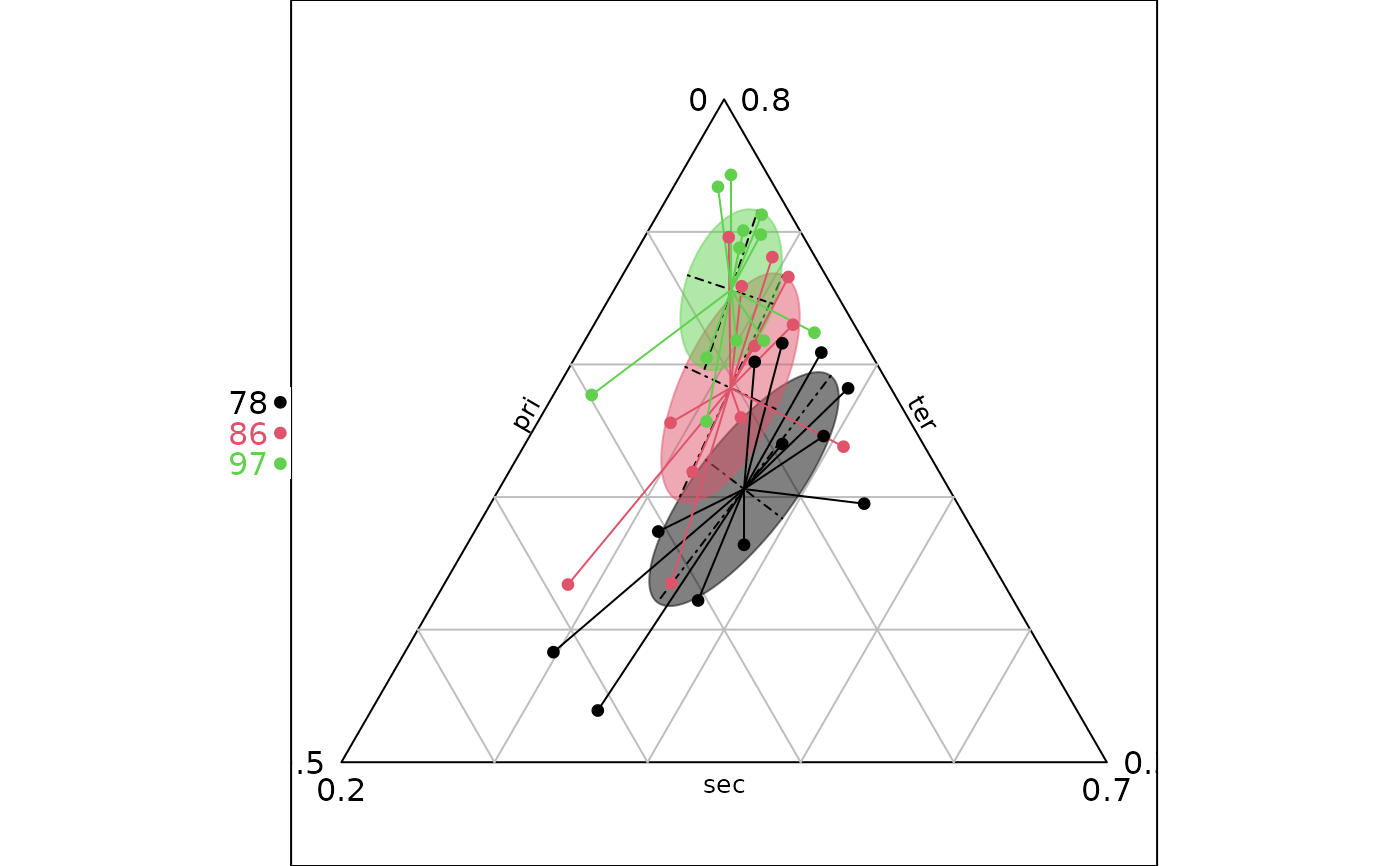
Ternary plot with a partition in classes (levels of a factor)
triangle.class.RdThis function represents a three dimensional scatter plot with a partition in classes (levels of a factor).
Arguments
- dfxyz
a three columns data frame used to produce the plot
- fac
a factor (or a matrix of factors) splitting the rows of
dfxyz- wt
a vector of weights for
fac- labels
a character vector containing the class' labels
- col
a logical, a color or a colors vector to color points, ellipses, labels, lines and polygons
- ellipseSize
a positive number for ellipse size
- starSize
a number between 0 and 1 for the size of the stars segments joining the stars' center (centroids) and the matching points
- chullSize
NULLor a vector of numbers between 0 and 1 for the fraction of points included in the convex hull- adjust
a logical to adjust the device with the limits of the smaller equilateral triangle containing the values
- min3d
a vector of three values for triangular minimal limits
- max3d
a vector of three values for triangular maximal limits
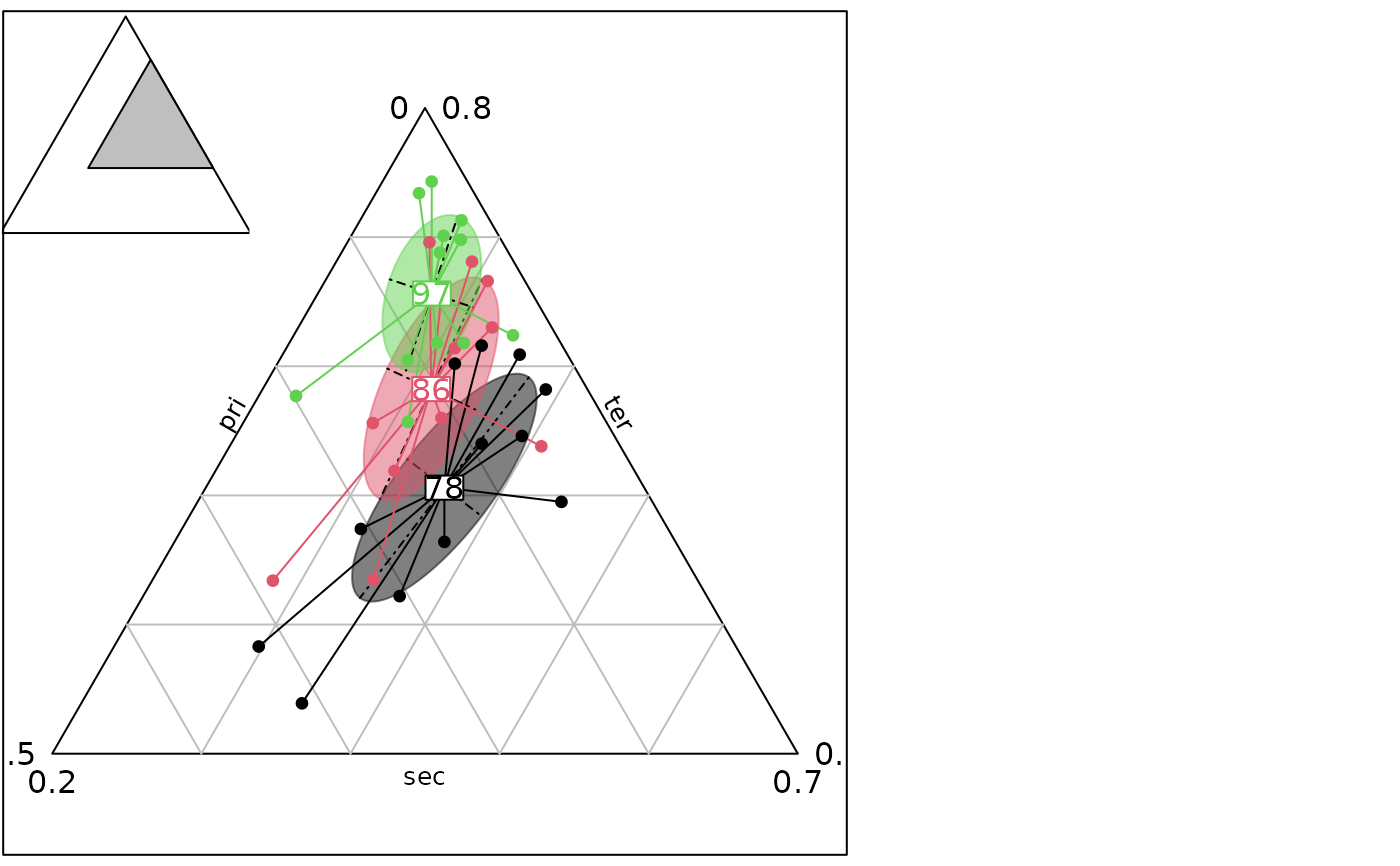
- showposition
a logical indicating whether the used triangle should be shown in the complete one
- facets
a factor splitting the rows of
dfxyzso that subsets of the data are represented on different sub-graphics- plot
a logical indicating if the graphics is displayed
- storeData
a logical indicating if the data are stored in the returned object. If
FALSE, only the names of the data arguments are stored- add
a logical. If
TRUE, the graphic is superposed to the graphics already plotted in the current device- pos
an integer indicating the position of the environment where the data are stored, relative to the environment where the function is called. Useful only if
storeDataisFALSE- ...
additional graphical parameters (see
adegparandtrellis.par.get)
Value
An object of class ADEg (subclass Tr.class) or ADEgS (if showposition is TRUE,
if add is TRUE and/or if facets are used).
The result is displayed if plot is TRUE.
Author
Alice Julien-Laferriere, Aurelie Siberchicot aurelie.siberchicot@univ-lyon1.fr and Stephane Dray
Examples
data(euro123, package = "ade4")
fac1 <- euro123$plan$an
df1 <- rbind.data.frame(euro123$in78, euro123$in86, euro123$in97)
triangle.class(df1, fac = fac1, showposition = TRUE, col = c(1, 2, 3))

triangle.class(df1, fac = fac1, showposition = FALSE, plabels.cex = 0, col = c(1, 2, 3),
  key = list(space = "left"))
triangle.class(df1, fac = fac1, showposition = FALSE, plabels.cex = 0, col = c(1, 2, 3),
key = list(space = "left"))