2-D scatter plot with proportional symbols (bubble plot)
s.value.RdThis function represents a two dimensional scatter plot with a third value represented by symbols.
Arguments
- dfxy
a data frame used to produce the plot
- z
a vector (or a matrix) with as many values as rows in
dfxy- breaks
a vector containing the breaks used for splitting
zvalue. IfNULL,pretty(z, n)is used.- xax
an integer (or a vector) indicating which column(s) of
dfxyis(are) plotted on the x-axis- yax
an integer (or a vector) indicating which column(s) of
dfxyis(are) plotted on the y-axis- method
colororsizevalue for representz. Ifcolor, a palette of color is used for the symbols (one color per interval). Ifsize, symbols of proportional area are used. Area is 0 for values equals to center (default 0). Two colors are used, for values less than center and larger than center.- symbol
value for symbol type
- col
a color or a colors vector to color symbols. If
methodissize, a 2-length vector of color is expected. Ifmethodiscolor, it must have as many colors as the number of class.- nclass
an integer for the number of desired intervals, ignored if
breaksis not missing.- center
a center value for method
size- centerpar
a logical or a list to represent center value using elements in the
adegpar("ppoints")list- facets
a factor splitting the rows of
dfxyso that subsets of the data are represented on different sub-graphics- plot
a logical indicating if the graphics is displayed
- storeData
a logical indicating if the data should be stored in the returned object. If
FALSE, only the names of the data arguments are stored- add
a logical. If
TRUE, the graphic is superposed to the graphics already plotted in the current device- pos
an integer indicating the position of the environment where the data are stored, relative to the environment where the function is called. Useful only if
storeDataisFALSE- ...
additional graphical parameters (see
adegparandtrellis.par.get)
Value
An object of class ADEg (subclass S2.value) or ADEgS (if add is TRUE and/or
if facets or multidimensional z or vectors for xax/yax are used).
The result is displayed if plot is TRUE.
References
Tanimura, S. and Kuroiwa, C. and Mizota, T. 2006 Proportional symbol mapping in R Journal of Statistical Software 15, 1–7
Author
Alice Julien-Laferriere, Aurelie Siberchicot aurelie.siberchicot@univ-lyon1.fr and Stephane Dray
Examples
data(rpjdl, package = "ade4")
fau.coa <- ade4::dudi.coa(rpjdl$fau, scan = FALSE, nf = 3)
g1 <- s.value(fau.coa$li, fau.coa$li[,3])
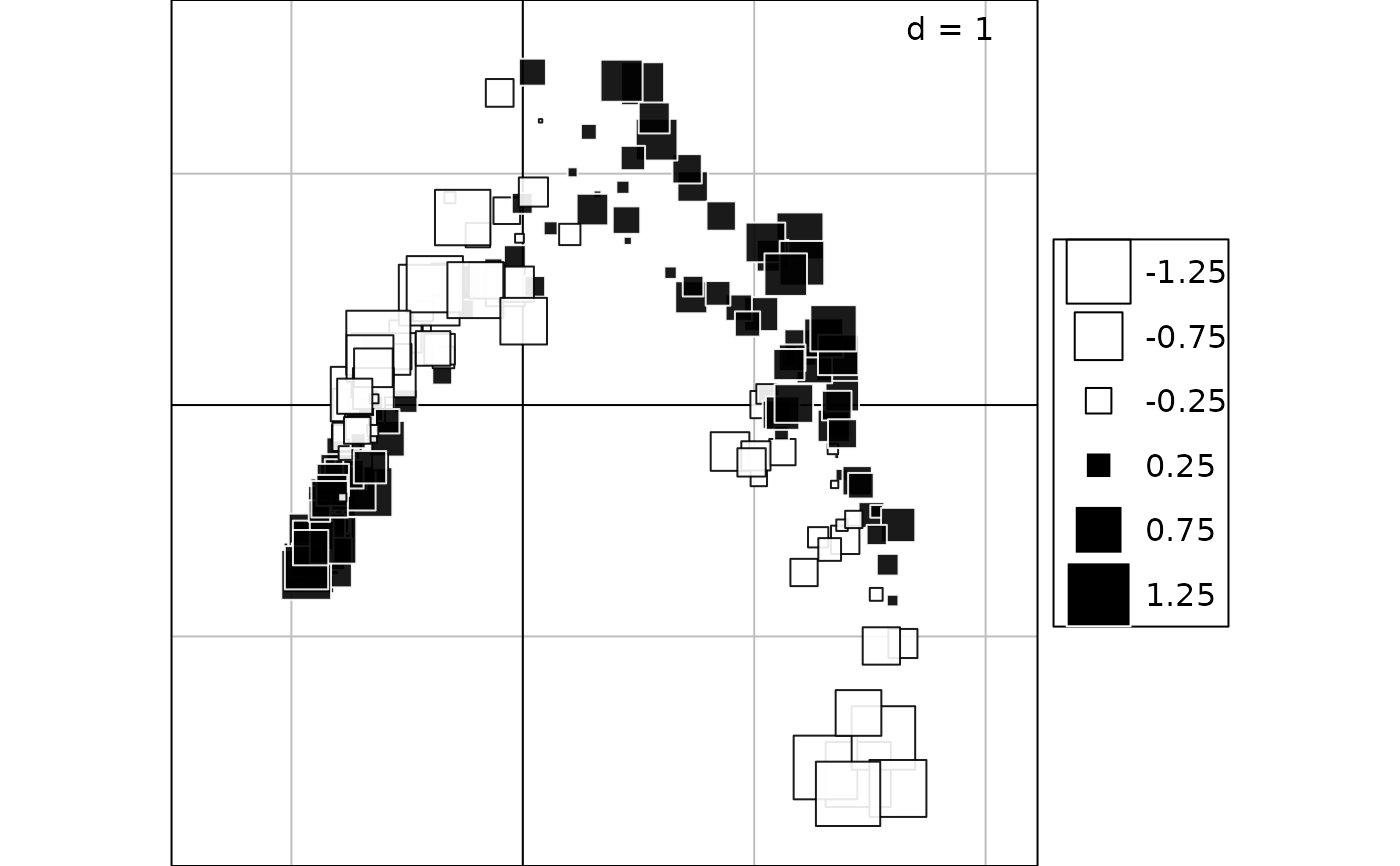
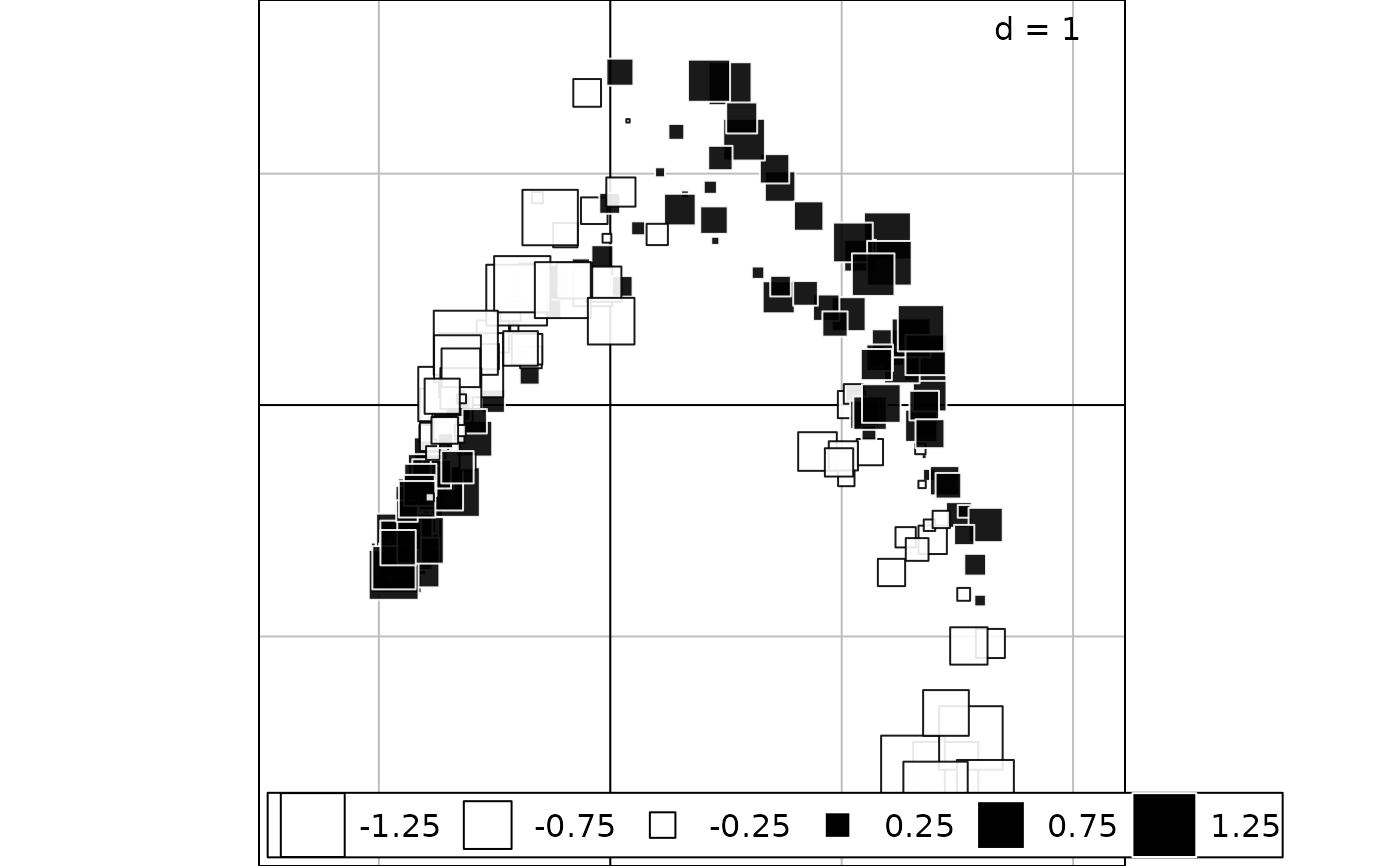 update(g1, key = list(space = "right", columns = 1))
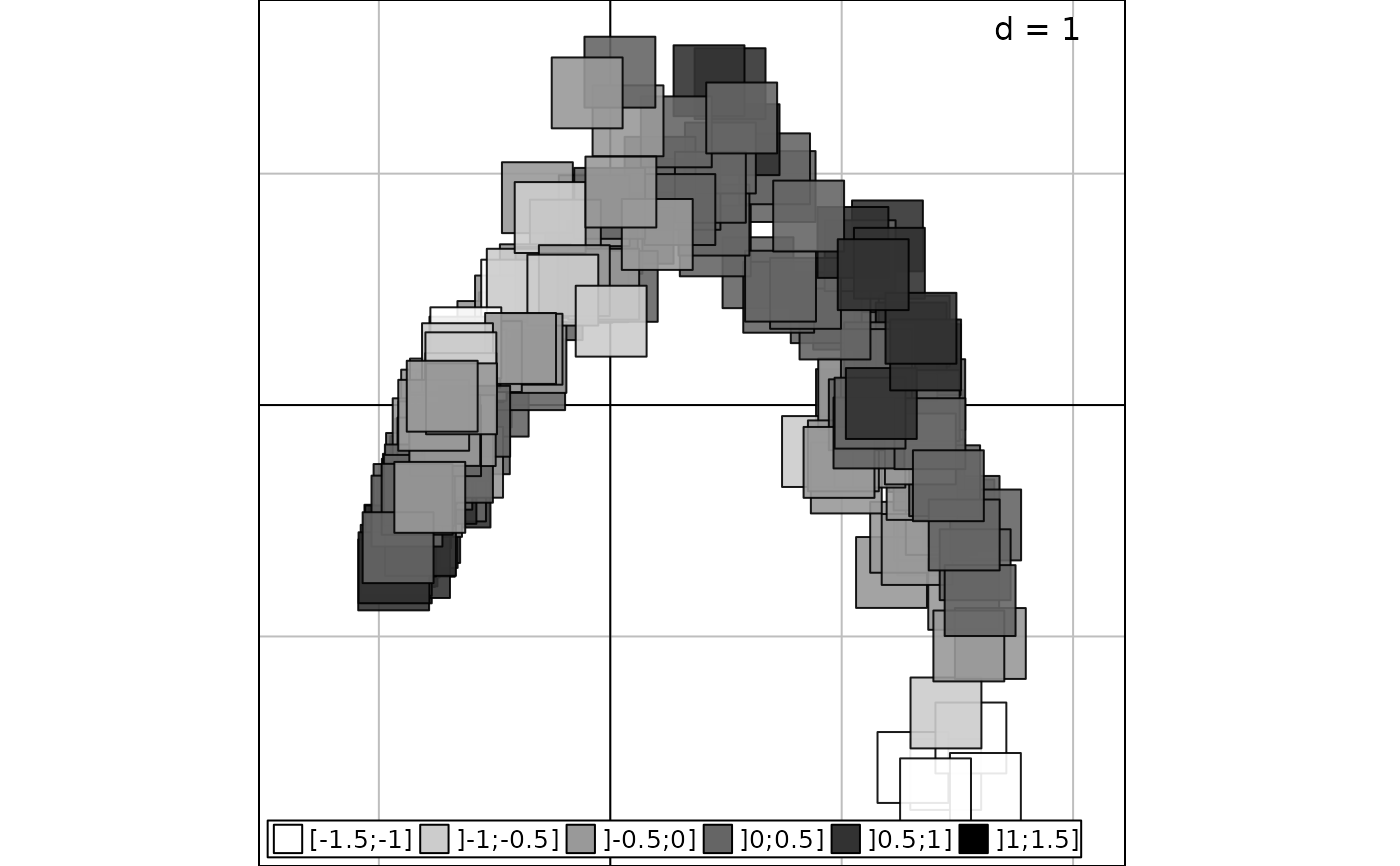
 g2 <- s.value(fau.coa$li, fau.coa$li[,3], method = "color", plegend.size = 0.8)
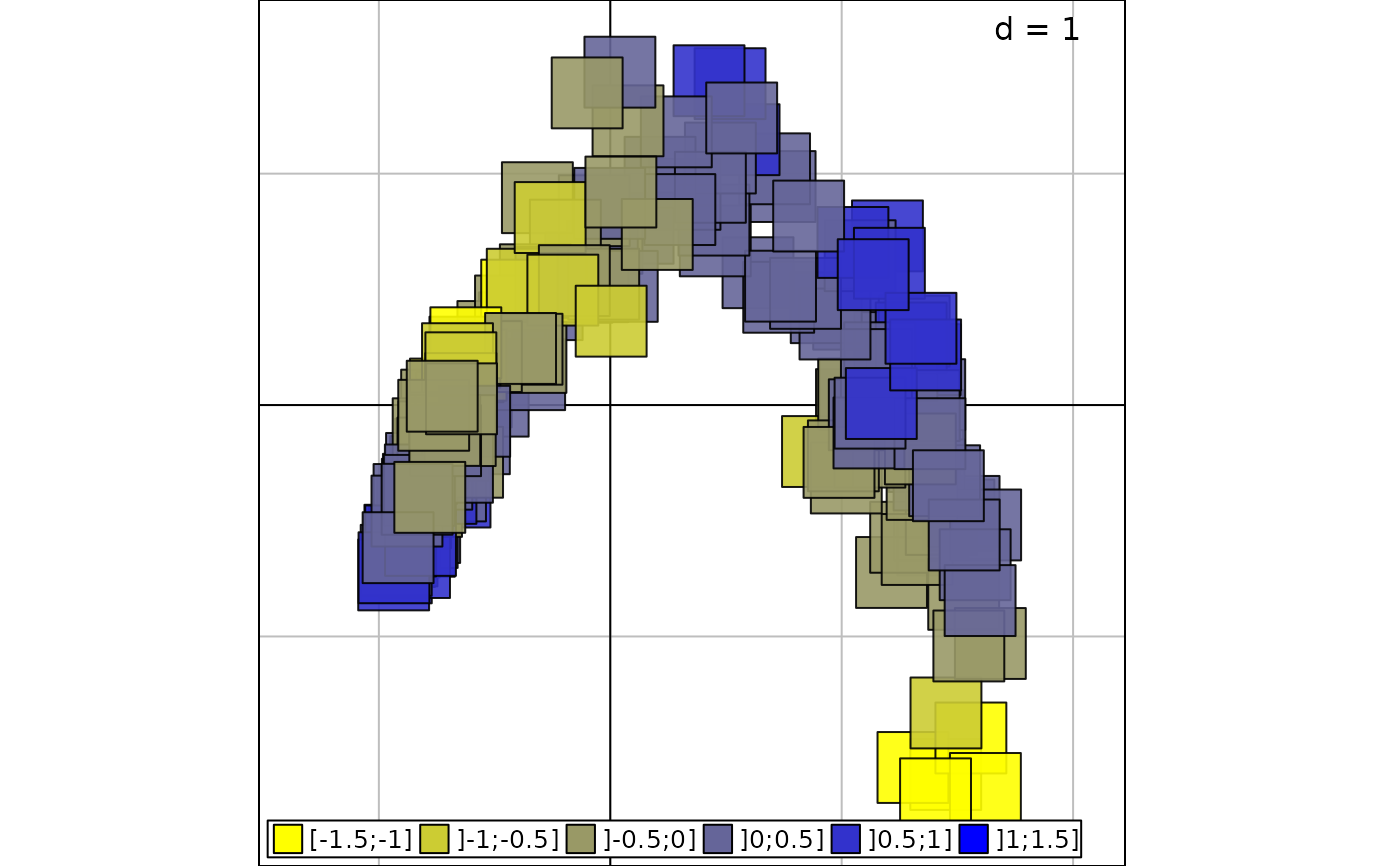
 g3 <- s.value(fau.coa$li, fau.coa$li[,3], plegend.size = 0.8, symbol = "square",
method = "color", col = colorRampPalette(c("yellow", "blue"))(6))
g3 <- s.value(fau.coa$li, fau.coa$li[,3], plegend.size = 0.8, symbol = "square",
method = "color", col = colorRampPalette(c("yellow", "blue"))(6))
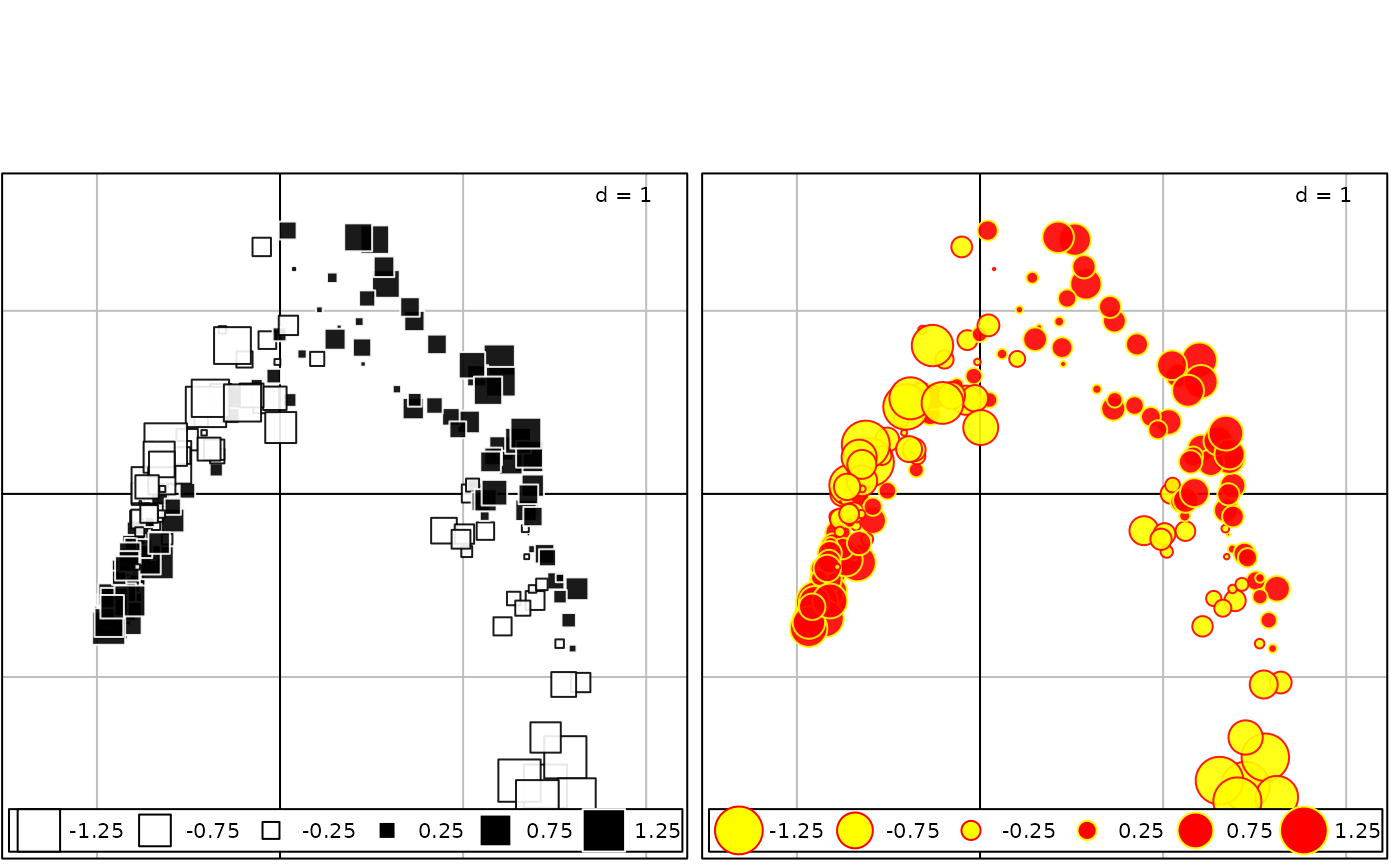
 g4 <- s.value(fau.coa$li, fau.coa$li[,3], plot = FALSE)
g5 <- s.value(fau.coa$li, fau.coa$li[, 3], center = 0, method = "size",
symbol = "circle", col = c("yellow", "red"), plot = FALSE)
g6 <- ADEgS(c(g4, g5), positions = layout2position(matrix(c(1, 2), 1, 2)),
add = matrix(0, ncol = 2, nrow = 2))
g4 <- s.value(fau.coa$li, fau.coa$li[,3], plot = FALSE)
g5 <- s.value(fau.coa$li, fau.coa$li[, 3], center = 0, method = "size",
symbol = "circle", col = c("yellow", "red"), plot = FALSE)
g6 <- ADEgS(c(g4, g5), positions = layout2position(matrix(c(1, 2), 1, 2)),
add = matrix(0, ncol = 2, nrow = 2))
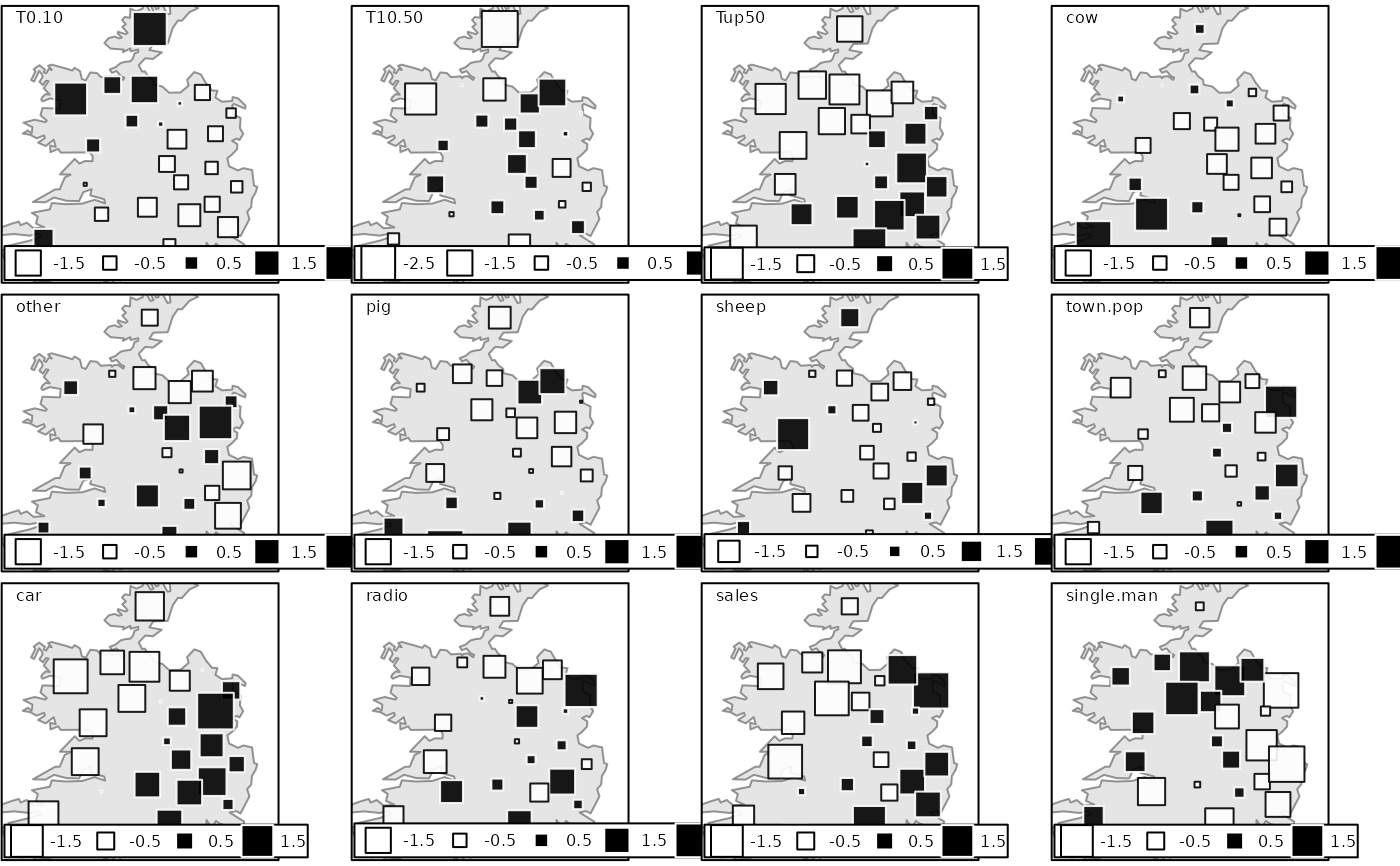
 data(irishdata, package = "ade4")
irq0 <- data.frame(scale(irishdata$tab, scale = TRUE))
g7 <- s.value(irishdata$xy.utm, irq0, Sp = irishdata$Spatial.contour, paxes.draw = FALSE,
pgrid.draw = FALSE, pSp.alpha = 0.4)
data(irishdata, package = "ade4")
irq0 <- data.frame(scale(irishdata$tab, scale = TRUE))
g7 <- s.value(irishdata$xy.utm, irq0, Sp = irishdata$Spatial.contour, paxes.draw = FALSE,
pgrid.draw = FALSE, pSp.alpha = 0.4)