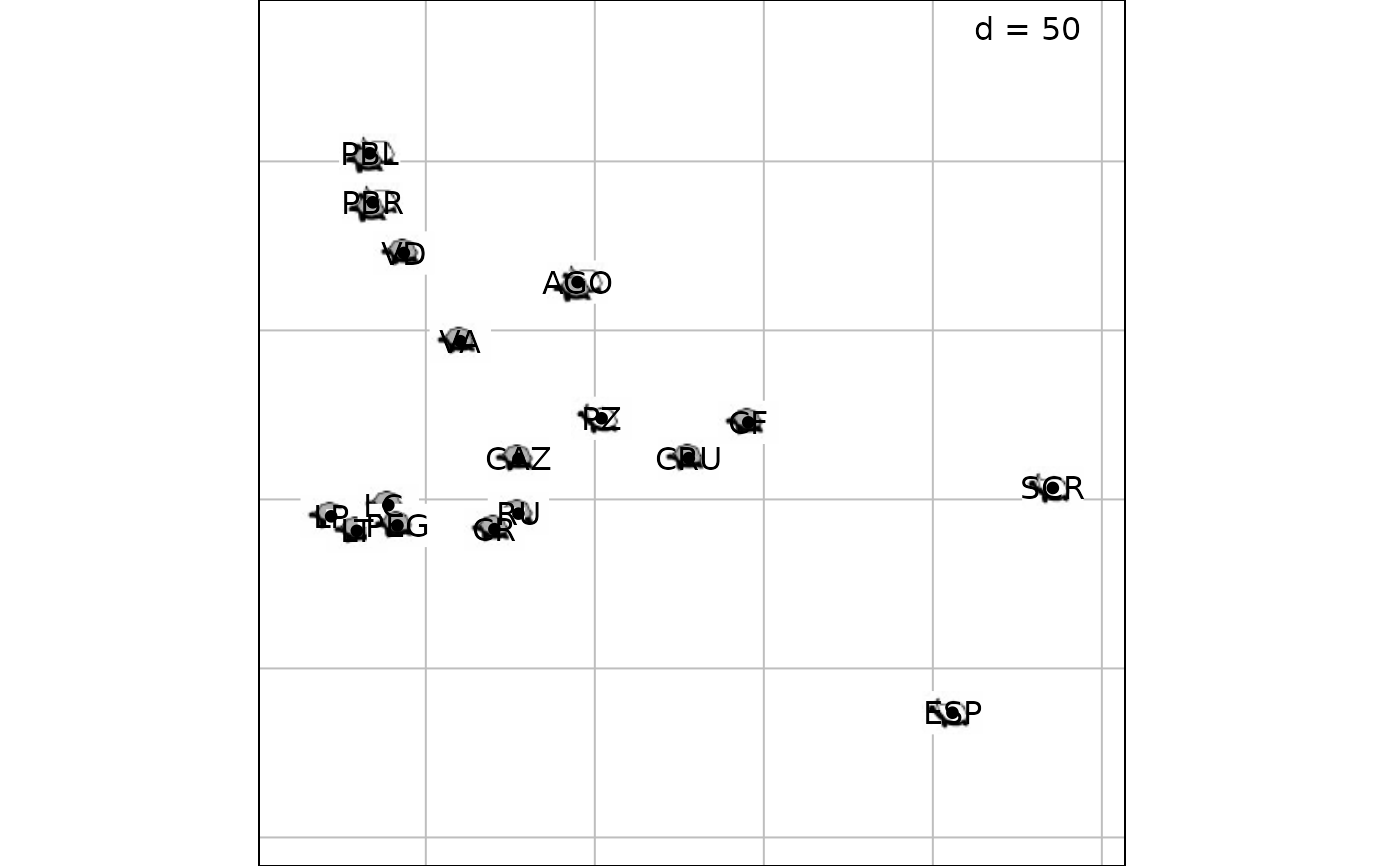
2-D scatter plot with logos (bitmap objects)
s.logo.RdThis function represents a two dimensional scatter plot associating logos with points.
Usage
s.logo(dfxy, logos, xax = 1, yax = 2, facets = NULL,
  plot = TRUE, storeData = TRUE, add = FALSE, pos = -1, ...)
Arguments
- dfxy
a data frame used to produce the plot
- logos
a list containing the picture to use for each point
- xax
an integer (or a vector) indicating which column(s) of
dfxyis(are) plotted on the x-axis- yax
an integer (or a vector) indicating which column(s) of
dfxyis(are) plotted on the y-axis- facets
a factor splitting the rows of
dfxyso that subsets of the data are represented on different sub-graphics- plot
a logical indicating if the graphics is displayed
- storeData
a logical indicating if the data should be stored in the returned object. If
FALSE, only the names of the data arguments are stored- add
a logical. If
TRUE, the graphic is superposed to the graphics already plotted in the current device- pos
an integer indicating the position of the environment where the data are stored, relative to the environment where the function is called. Useful only if
storeDataisFALSE- ...
additional graphical parameters (see
adegparandtrellis.par.get)
Value
An object of class ADEg (subclass S2.logo) or ADEgS (if add is TRUE and/or
if facets or vectors for xax/yax are used).
The result is displayed if plot is TRUE.
Author
Alice Julien-Laferriere, Aurelie Siberchicot aurelie.siberchicot@univ-lyon1.fr and Stephane Dray
Examples
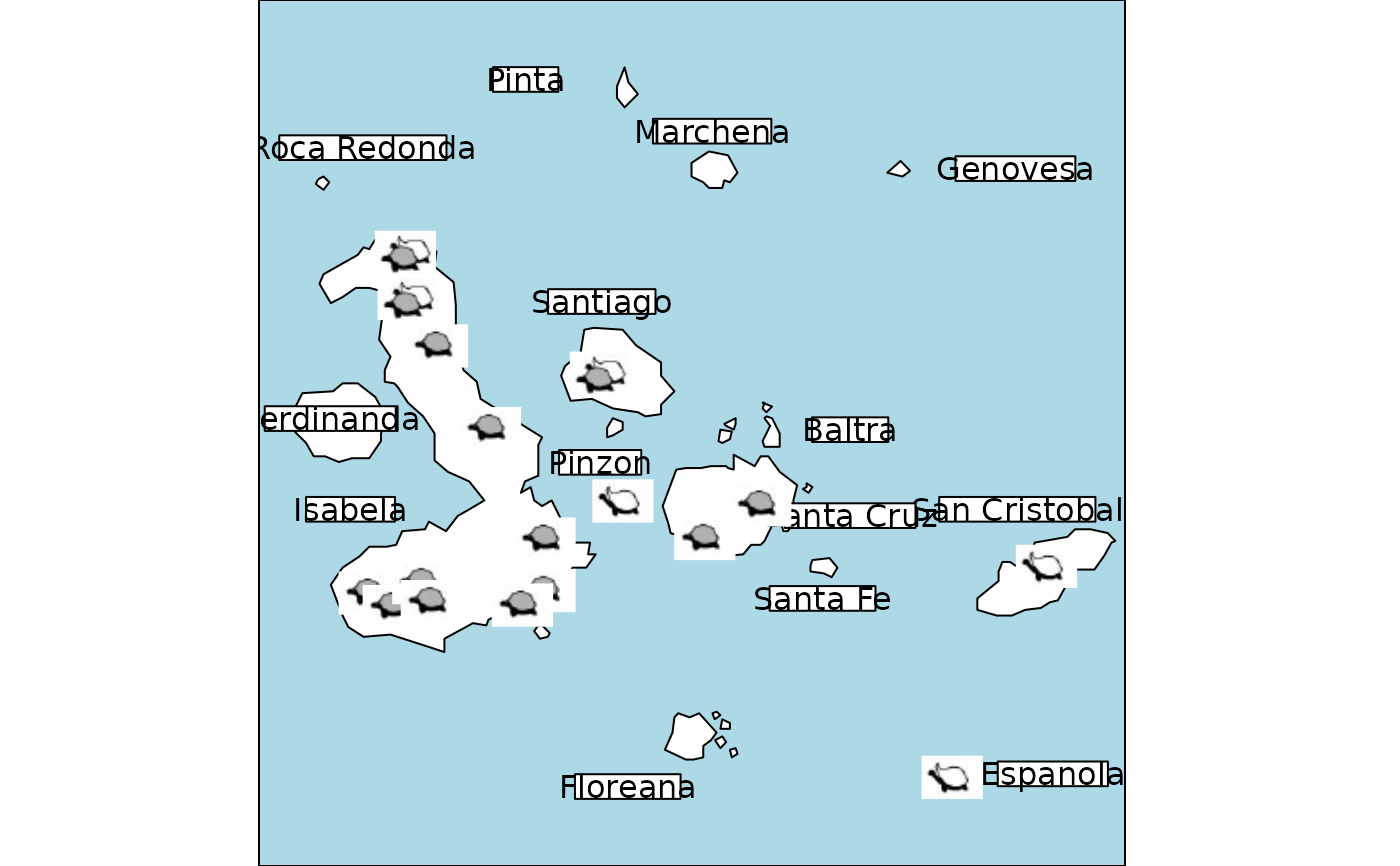
data(ggtortoises, package = "ade4")
g1 <- s.logo(ggtortoises$pop,
ggtortoises$ico[as.character(ggtortoises$pop$carap)],
pori.incl = FALSE, ppoints.cex = 0.5)
#> Loading required package: pixmap
g1 <- s.label(ggtortoises$pop, add = TRUE, plabels.boxes.alpha = 0)
 g2 <- s.label(ggtortoises$misc, pgrid.draw = FALSE,
porigin.include = FALSE, paxes.draw = FALSE,
Sp = ggtortoises$Spatial, pback.col = "lightblue", pSp.col = "white")
g2 <- s.logo(ggtortoises$pop, ggtortoises$ico[as.character(ggtortoises$pop$carap)],
ppoints.cex = 0.5, add = TRUE)
g2 <- s.label(ggtortoises$misc, pgrid.draw = FALSE,
porigin.include = FALSE, paxes.draw = FALSE,
Sp = ggtortoises$Spatial, pback.col = "lightblue", pSp.col = "white")
g2 <- s.logo(ggtortoises$pop, ggtortoises$ico[as.character(ggtortoises$pop$carap)],
ppoints.cex = 0.5, add = TRUE)
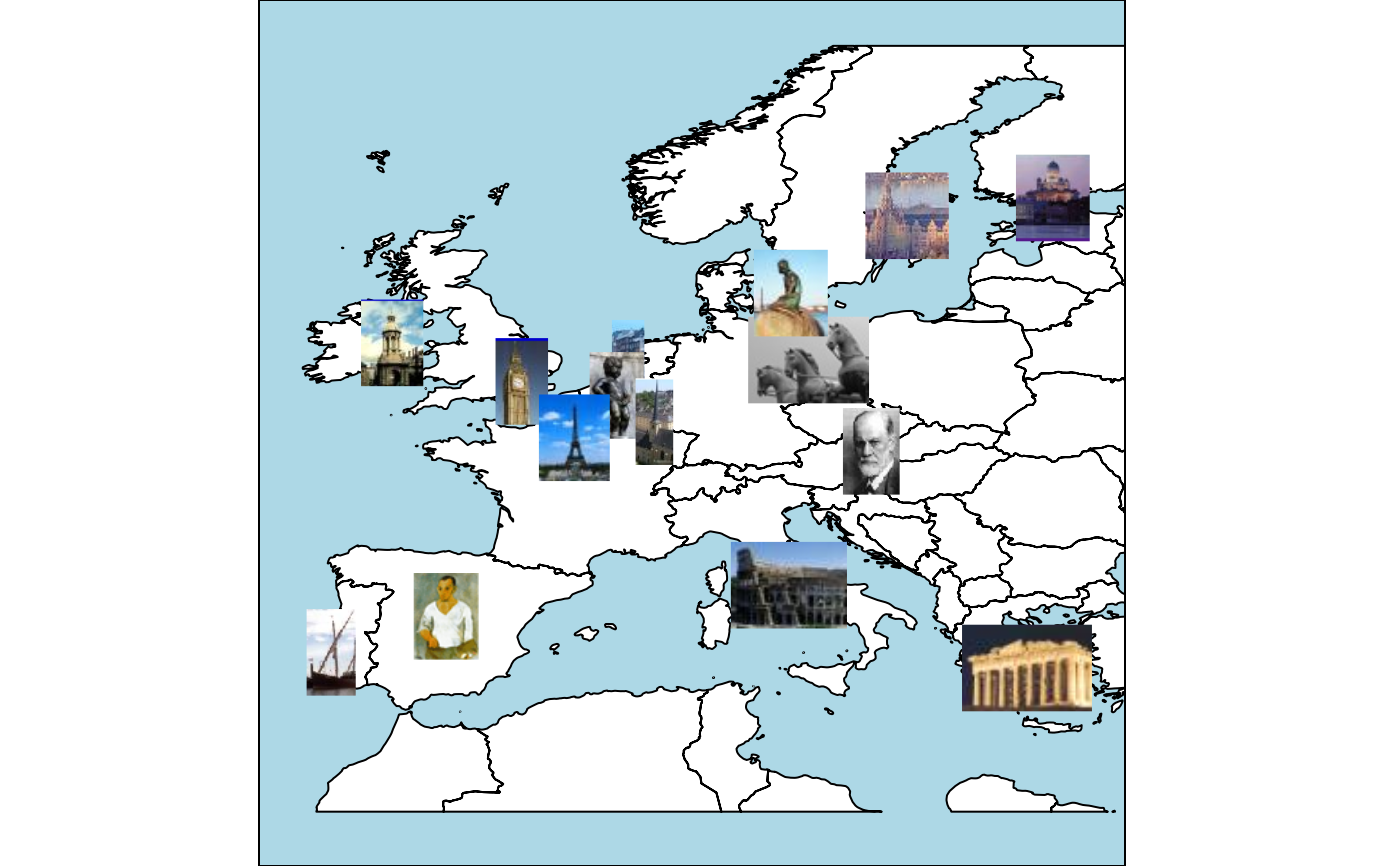
 data(capitales, package = "ade4")
g3 <- s.logo(capitales$xy[sort(rownames(capitales$xy)), ], capitales$logo,
Sp = capitales$Spatial, pback.col = "lightblue", pSp.col = "white",
pgrid.draw = FALSE)
data(capitales, package = "ade4")
g3 <- s.logo(capitales$xy[sort(rownames(capitales$xy)), ], capitales$logo,
Sp = capitales$Spatial, pback.col = "lightblue", pSp.col = "white",
pgrid.draw = FALSE)