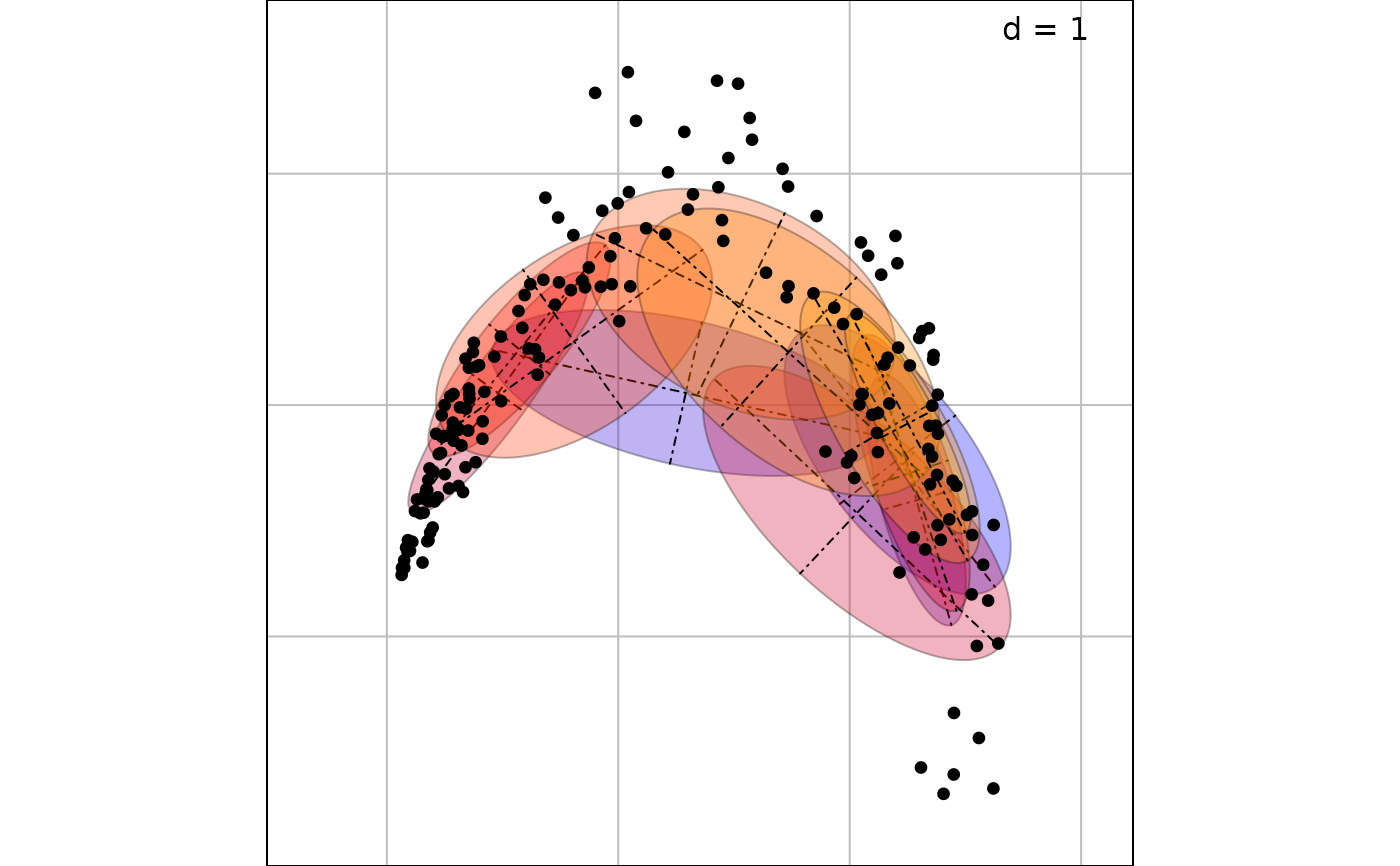
2-D scatter plot with means/standard deviations computed using an external table of weights
s.distri.RdThis function represents a two dimensional scatter plot of a frequency distribution. Class are defined by ellipses and/or stars.
Usage
s.distri(dfxy, dfdistri, xax = 1, yax = 2, starSize = 1,
  ellipseSize = 1.5, col = NULL, facets = NULL, plot = TRUE,
  storeData = TRUE, add = FALSE, pos = -1, ...)
Arguments
- dfxy
a data frame used to produce the plot
- dfdistri
a data frame containing the mass distribution in columns
- xax
an integer (or a vector) indicating which column(s) of
dfxyis(are) plotted on the x-axis- yax
an integer (or a vector) indicating which column(s) of
dfxyis(are) plotted on the y-axis- starSize
NULLor number between 0 and 1 for the size of the stars segments joining the stars' center (centroids) and the matching points- ellipseSize
NULLor number between 0 and 1 for ellipse size- col
a color or a colors vector to color points, ellipses, labels, lines and polygons
- facets
a factor splitting the rows of
dfxyso that subsets of the data are represented on different sub-graphics- plot
a logical indicating if the graphics is displayed
- storeData
a logical indicating if the data should be stored in the returned object. If
FALSE, only the names of the data arguments are stored- add
a logical. If
TRUE, the graphic is superposed to the graphics already plotted in the current device- pos
an integer indicating the position of the environment where the data are stored, relative to the environment where the function is called. Useful only if
storeDataisFALSE- ...
additional graphical parameters (see
adegparandtrellis.par.get)
Value
An object of class ADEg (subclass S2.distri) or ADEgS (if add is TRUE and/or
if facets or vectors for xax/yax are used).
The result is displayed if plot is TRUE.
Author
Alice Julien-Laferriere, Aurelie Siberchicot aurelie.siberchicot@univ-lyon1.fr and Stephane Dray
Examples
data(rpjdl, package = "ade4")
xy <- ade4::dudi.coa(rpjdl$fau, scan = FALSE)$li
j <- c(1, 5, 8, 20, 21, 23, 26, 33, 36, 44, 47, 49)
dfdistri <- rpjdl$fau[, j]
coli <- colorRampPalette(c("blue", "red", "orange"))(49)[j]

s.distri(xy, dfdistri, ellipseSize = 1, starSize = 0, porigin.include = FALSE,
  pellipses = list(col = coli, alpha = 0.3), plabels.cex = 0)