Adds segments on graphics.
addsegment.RdAdds a trellis object containing one or several segments on one or several graphical objects.
Arguments
- object
an object of class
ADEgorADEgS- x0, y0
coordinates of points FROM which to draw, passed to the
panel.segmentsfunction of thelatticepackage. See Details.- x1, y1
coordinates of points TO which to draw, passed to the
panel.segmentsfunction of thelatticepackage. See Details.- plot
a logical indicating if the graphics is displayed
- ...
Other arguments. Additional graphical parameters (see the
plineslist inadegparandtrellis.par.get). Ifobjectis anADEgS, the argumentwhichidentify whichADEgis/are used for superposition.
Details
x0, y0, x1 and y1 can be vectors. A line segment
is drawn, for each i, between the point (x0[i], y0[i]) and the point
(x1[i], y1[i]). The coordinate vectors will be recycled to the length of the longest.
Author
Aurelie Siberchicot aurelie.siberchicot@univ-lyon1.fr and Stephane Dray
Examples
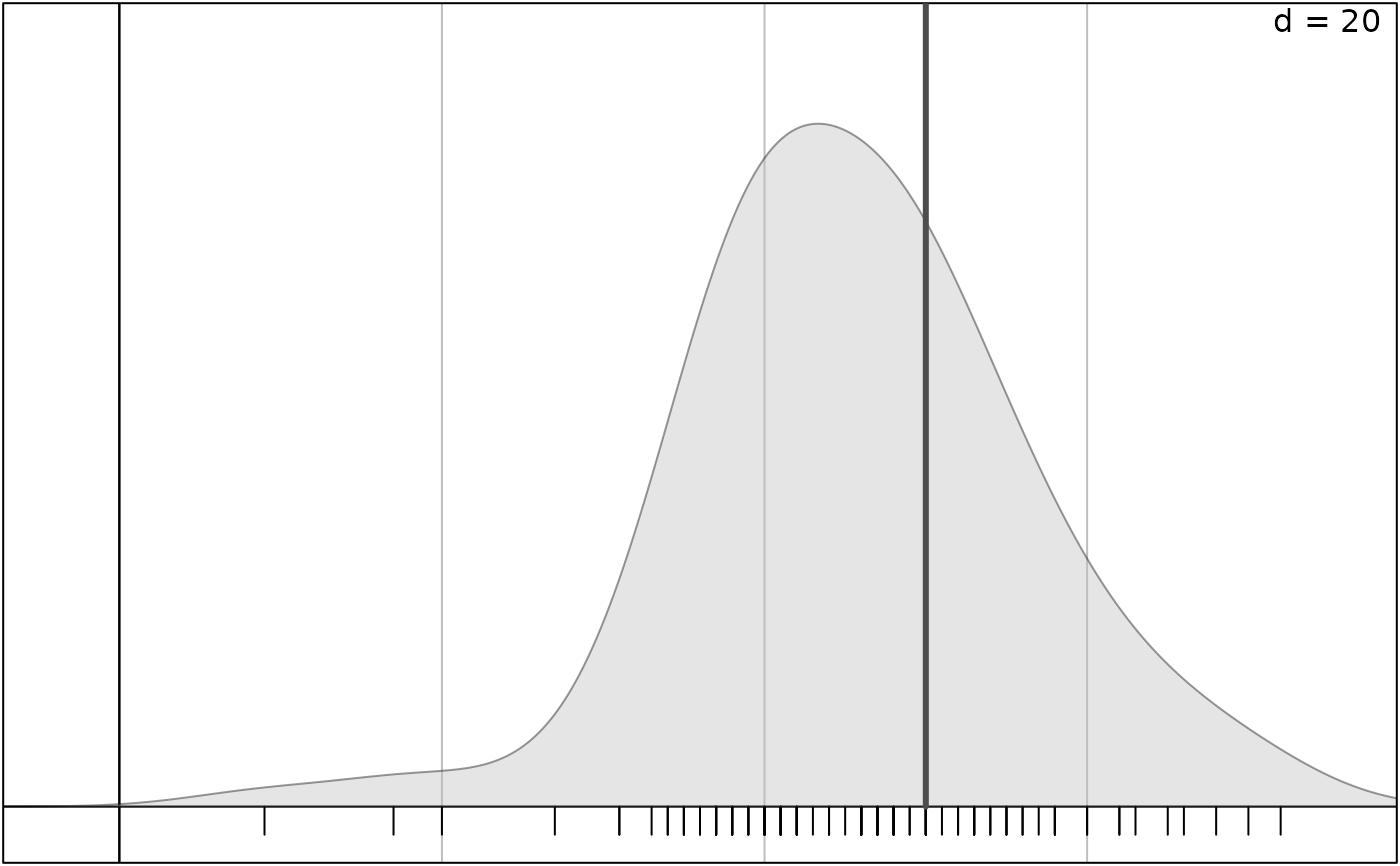
data(deug, package = "ade4")
g11 <- s1d.density(deug$tab[, 1], plot = FALSE)
g12 <- addsegment(g11, x0 = deug$cent[1], x1 = deug$cent[1], y0 = 0, y1 = 1,
plines = list(col = "grey30", lwd = 3))
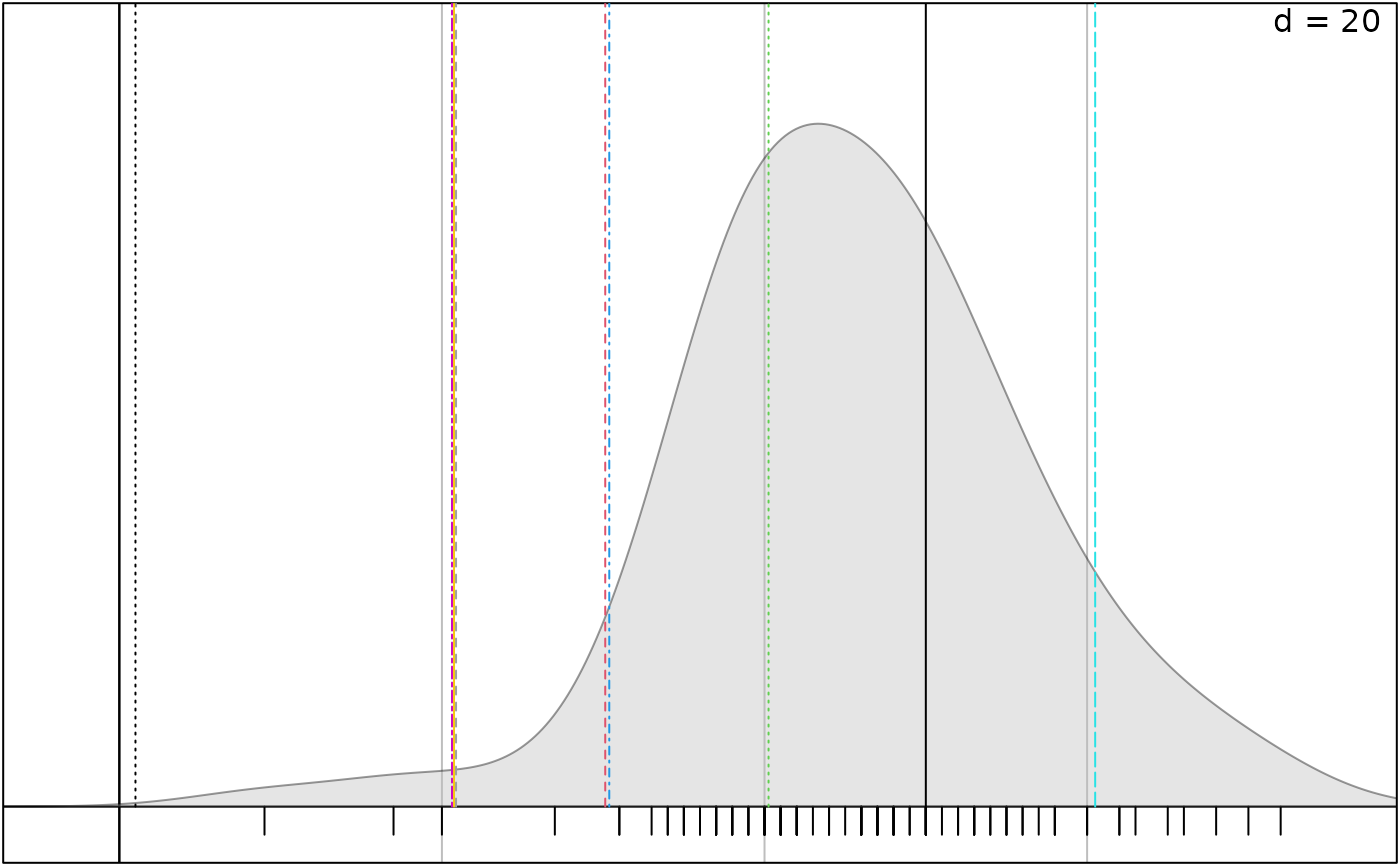
 g13 <- addsegment(g11,
x0 = deug$cent + seq(0, 1, length.out = length(deug$cent)),
x1 = deug$cent + seq(0, 1, length.out = length(deug$cent)),
y0 = 0, y1 = 1,
plines = list(col = 1:length(deug$cent), lty = 1:length(deug$cent)))
g13 <- addsegment(g11,
x0 = deug$cent + seq(0, 1, length.out = length(deug$cent)),
x1 = deug$cent + seq(0, 1, length.out = length(deug$cent)),
y0 = 0, y1 = 1,
plines = list(col = 1:length(deug$cent), lty = 1:length(deug$cent)))
 # example extracted from the pedagogic file, here: http://pbil.univ-lyon1.fr/R/pdf/tdr65.pdf
data(monde84, package = "ade4")
dfX <- cbind.data.frame(lpib = log(monde84$pib), croipop = monde84$croipop)
dfY <- cbind.data.frame(lmorta = log(monde84$morta), lanal = log(monde84$anal + 1),
rscol = sqrt(100 - monde84$scol))
dfX0 <- ade4::scalewt(dfX)
dfY0 <- ade4::scalewt(dfY)
can1 <- cancor(dfX0, dfY0)
varcanoX <- dfX0 %*% can1$xcoef[,1]
varcanoY <- dfY0 %*% can1$ycoef[,1]
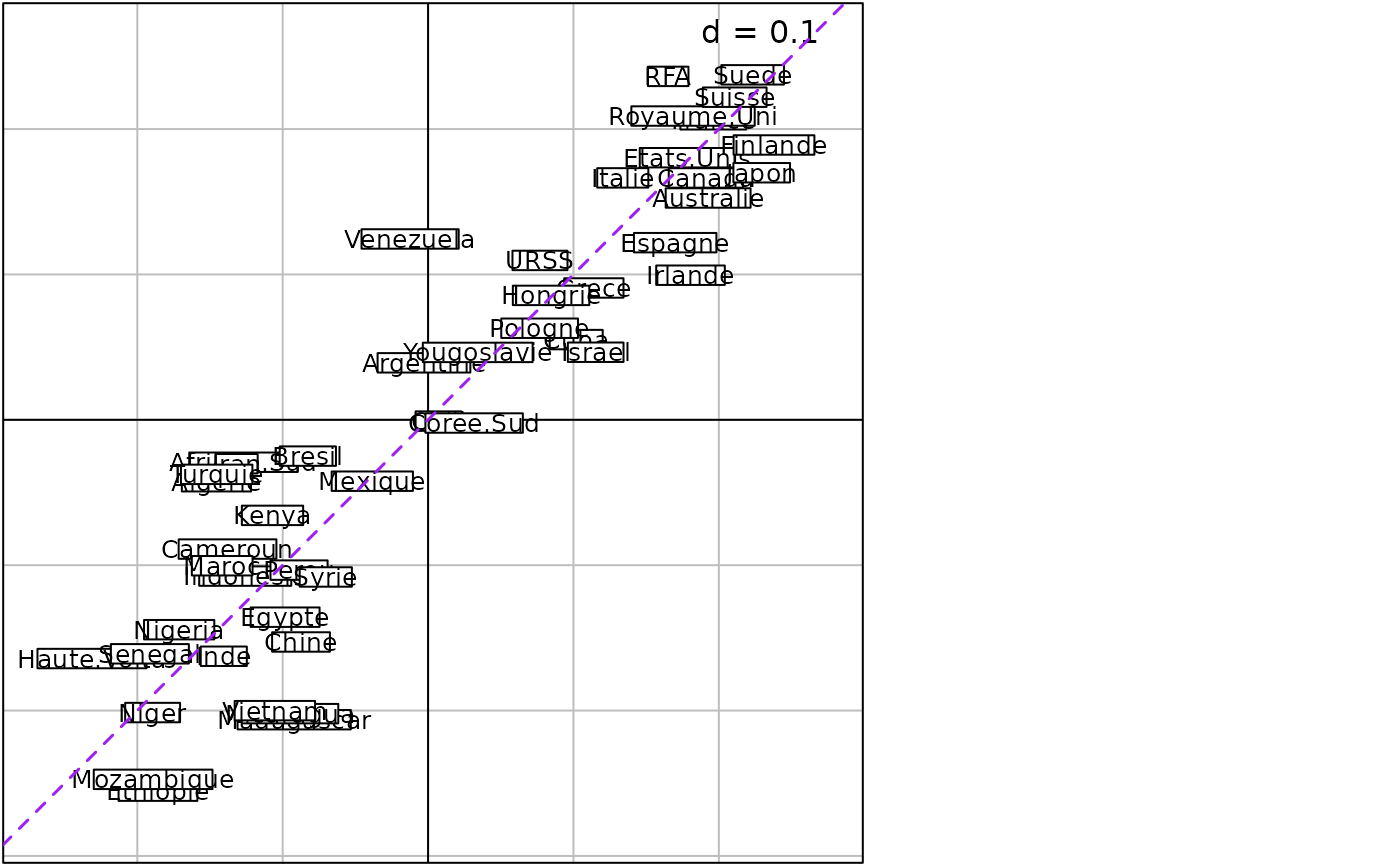
g21 <- s.label(cbind(varcanoY,varcanoX), labels = row.names(monde84), plabel.cex = 0.8,
plot = FALSE)
g22 <- addsegment(g21, -1.25, -1.25, 1.25, 1.25, plines.col = "purple", plines.lwd = 1.5,
plines.lty = 2)
# example extracted from the pedagogic file, here: http://pbil.univ-lyon1.fr/R/pdf/tdr65.pdf
data(monde84, package = "ade4")
dfX <- cbind.data.frame(lpib = log(monde84$pib), croipop = monde84$croipop)
dfY <- cbind.data.frame(lmorta = log(monde84$morta), lanal = log(monde84$anal + 1),
rscol = sqrt(100 - monde84$scol))
dfX0 <- ade4::scalewt(dfX)
dfY0 <- ade4::scalewt(dfY)
can1 <- cancor(dfX0, dfY0)
varcanoX <- dfX0 %*% can1$xcoef[,1]
varcanoY <- dfY0 %*% can1$ycoef[,1]
g21 <- s.label(cbind(varcanoY,varcanoX), labels = row.names(monde84), plabel.cex = 0.8,
plot = FALSE)
g22 <- addsegment(g21, -1.25, -1.25, 1.25, 1.25, plines.col = "purple", plines.lwd = 1.5,
plines.lty = 2)