Indirect Ordination
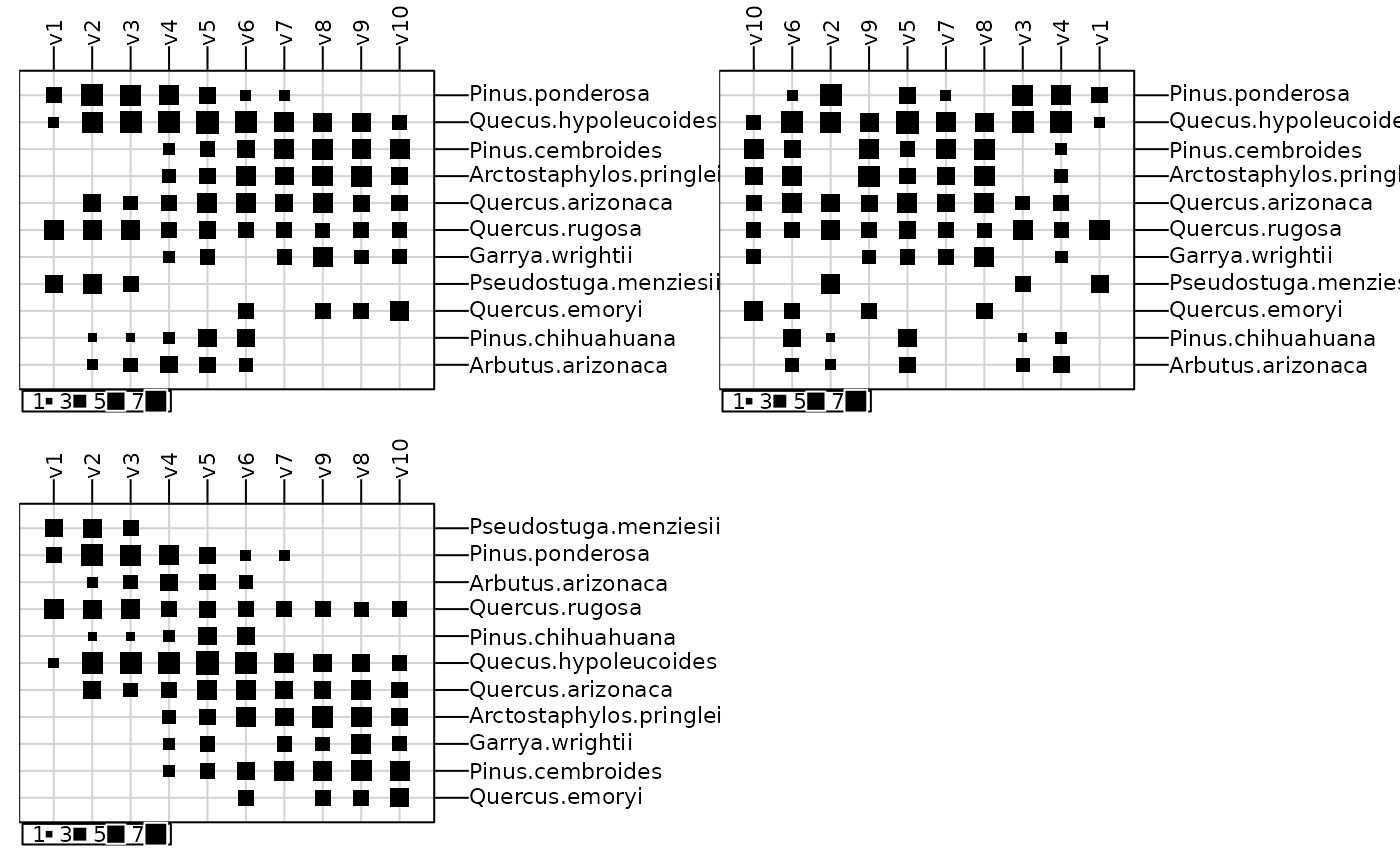
santacatalina.RdThis data set gives the densities per hectare of 11 species of trees for 10 transects of topographic moisture values (mean of several stations per class).
Usage
data(santacatalina)Source
Gauch, H. G. J., Chase, G. B. and Whittaker R. H. (1974) Ordination of vegetation samples by Gaussian species distributions. Ecology, 55, 1382–1390.
Examples
data(santacatalina)
coa1 <- dudi.coa(log(santacatalina + 1), scan = FALSE) # 2 factors

if(adegraphicsLoaded()) {
  g1 <- table.value(log(santacatalina + 1), plot = FALSE)
  g2 <- table.value(log(santacatalina + 1)[, sample(10)], plot = FALSE)
  g3 <- table.value(log(santacatalina + 1)[order(coa1$li[, 1]), order(coa1$co[, 1])], plot = FALSE)
  g4 <- scatter(coa1, posi = "bottomright", plot = FALSE)
  G <- ADEgS(list(g1, g2, g3, g4), layout = c(2, 2))
} else {
  par(mfrow = c(2, 2))
  table.value(log(santacatalina + 1))
  table.value(log(santacatalina + 1)[, sample(10)])
  table.value(log(santacatalina + 1)[order(coa1$li[, 1]), order(coa1$co[, 1])])
  scatter(coa1, posi = "bottomright")
  par(mfrow = c(1, 1))
}
#> Error in s.label(dfxy = coa1$li, xax = 1, yax = 2, plot = FALSE, storeData = TRUE,     pos = -3, plabels = list(cex = 0.75), xlim = c(-1.15837003660113,     1.92781562406518), ylim = c(-1.56393452769017, 1.52225113297615    )): non convenient selection for dfxy (can not be converted to dataframe)
