African Estuary Fishes
baran95.RdThis data set is a list containing relations between sites and fish species linked to dates.
Usage
data(baran95)Format
This list contains the following objects:
- fau
is a data frame 95 seinings and 33 fish species.
- plan
is a data frame 2 factors : date and site. The
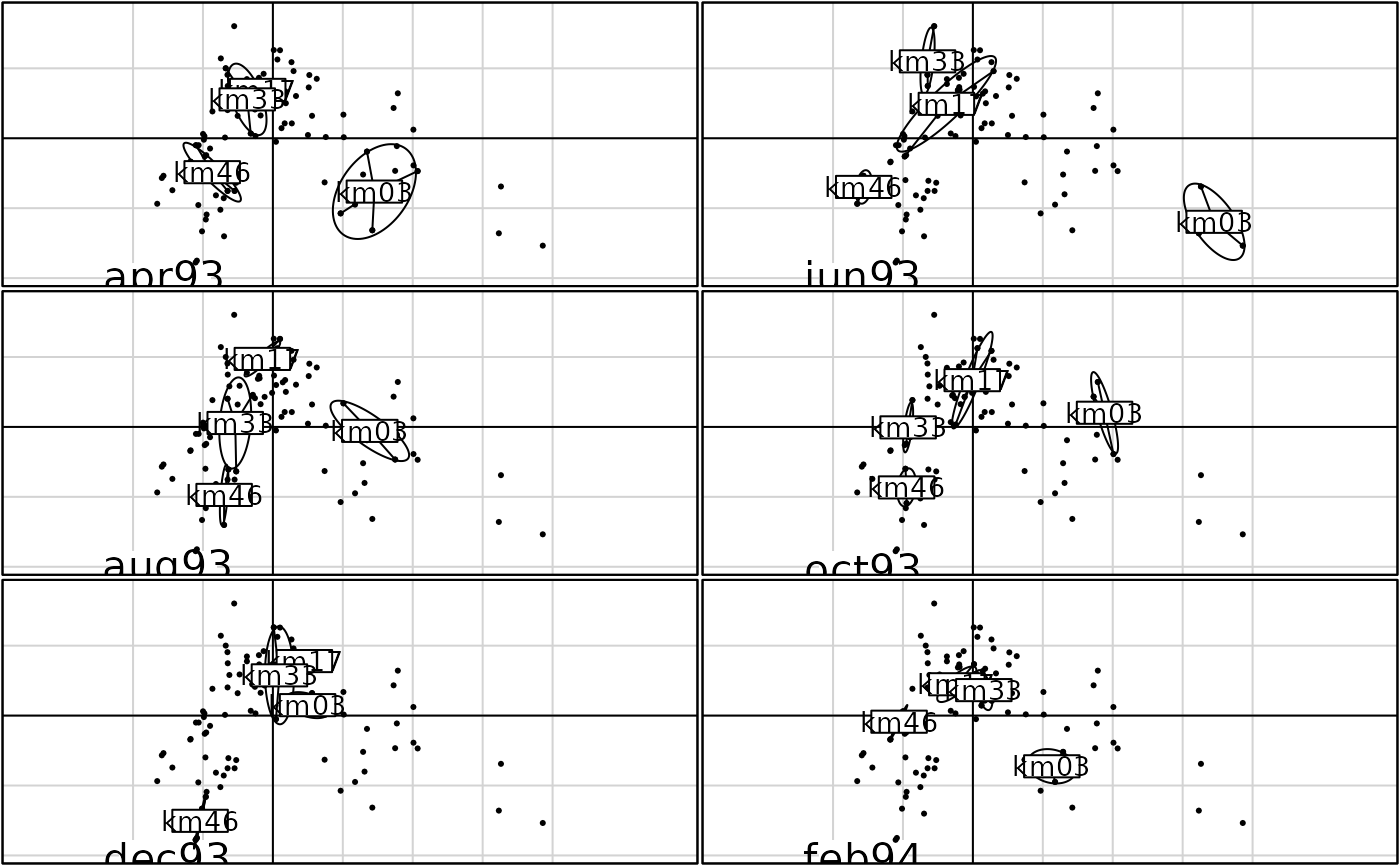
datehas 6 levels (april 1993, june 1993, august 1993, october 1993, december 1993 and february 1994) and thesitesare defined by 4 distances to the Atlantic Ocean (km03, km17, km33 and km46).- species.names
is a vector of species latin names.
Source
Baran, E. (1995) Dynamique spatio-temporelle des peuplements de Poissons estuariens en Guinée (Afrique de l'Ouest). Thèse de Doctorat, Université de Bretagne Occidentale. Data collected by net fishing sampling in the Fatala river estuary.
References
See a data description at http://pbil.univ-lyon1.fr/R/pdf/pps027.pdf (in French).
Examples
data(baran95)
w <- dudi.pca(log(baran95$fau + 1), scal = FALSE, scann = FALSE,
    nf = 3)
w1 <- wca(w, baran95$plan$date, scann = FALSE)
fatala <- ktab.within(w1)
stat1 <- statis(fatala, scan = FALSE, nf = 3)
mfa1 <- mfa(fatala, scan = FALSE, nf = 3)

if(adegraphicsLoaded()) {
  g1 <- s.class(stat1$C.Co, baran95$plan$site, facets = baran95$plan$date,
    pellipses.axes.draw = FALSE, ppoints.cex = 0.5, plot = FALSE)
  n1 <- length(g1@ADEglist)
  g2 <- ADEgS(lapply(1:n1, function(i) s.label(stat1$C.Co, plabels.cex = 0,
    ppoints.cex = 0.5, plot = FALSE)), positions = g1@positions, plot = FALSE)
  G1 <- superpose(g2, g1, plot = TRUE)

  G2 <- kplot(stat1, arrow = FALSE, traject = FALSE, class = baran95$plan$site,
    col.plabels.cex = 0, ppoints.cex = 0.5)

  g3 <- s.class(mfa1$co, baran95$plan$site, facets = baran95$plan$date,
    pellipses.axes.draw = FALSE, ppoints.cex = 0.5, plot = FALSE)
  n2 <- length(g3@ADEglist)
  g4 <- ADEgS(lapply(1:n2, function(i) s.label(mfa1$co, plabels.cex = 0,
    ppoints.cex = 0.5, plot = FALSE)), positions = g3@positions, plot = FALSE)
  G3 <- superpose(g4, g3, plot = TRUE)

} else {
  par(mfrow = c(3, 2))
  w2 <- split(stat1$C.Co, baran95$plan$date)
  w3 <- split(baran95$plan$site, baran95$plan$date)
  for (j in 1:6) {
    s.label(stat1$C.Co[,1:2], clab = 0, sub = tab.names(fatala)[j], csub = 3)
    s.class(w2[[j]][, 1:2], w3[[j]], clab = 2, axese = FALSE, add.plot = TRUE)
  }
  par(mfrow = c(1, 1))

  kplot(stat1, arrow = FALSE, traj = FALSE, clab = 2, uni = TRUE,
    class = baran95$plan$site) #simpler

  par(mfrow = c(3, 2))
  w4 <- split(mfa1$co, baran95$plan$date)
  for (j in 1:6) {
    s.label(mfa1$co[, 1:2], clab = 0, sub = tab.names(fatala)[j], csub = 3)
    s.class(w4[[j]][, 1:2], w3[[j]], clab = 2, axese = FALSE, add.plot = TRUE)
  }
  par(mfrow = c(1, 1))
}

#> Error in s.label(dfxy = stat1$C.Co, xax = 1, yax = 2, facets = stat1$TC[,     1], plot = FALSE, storeData = TRUE, pos = -3, plabels = list(    cex = 1.25), clab = 2, uni = TRUE): non convenient selection for dfxy (can not be converted to dataframe)