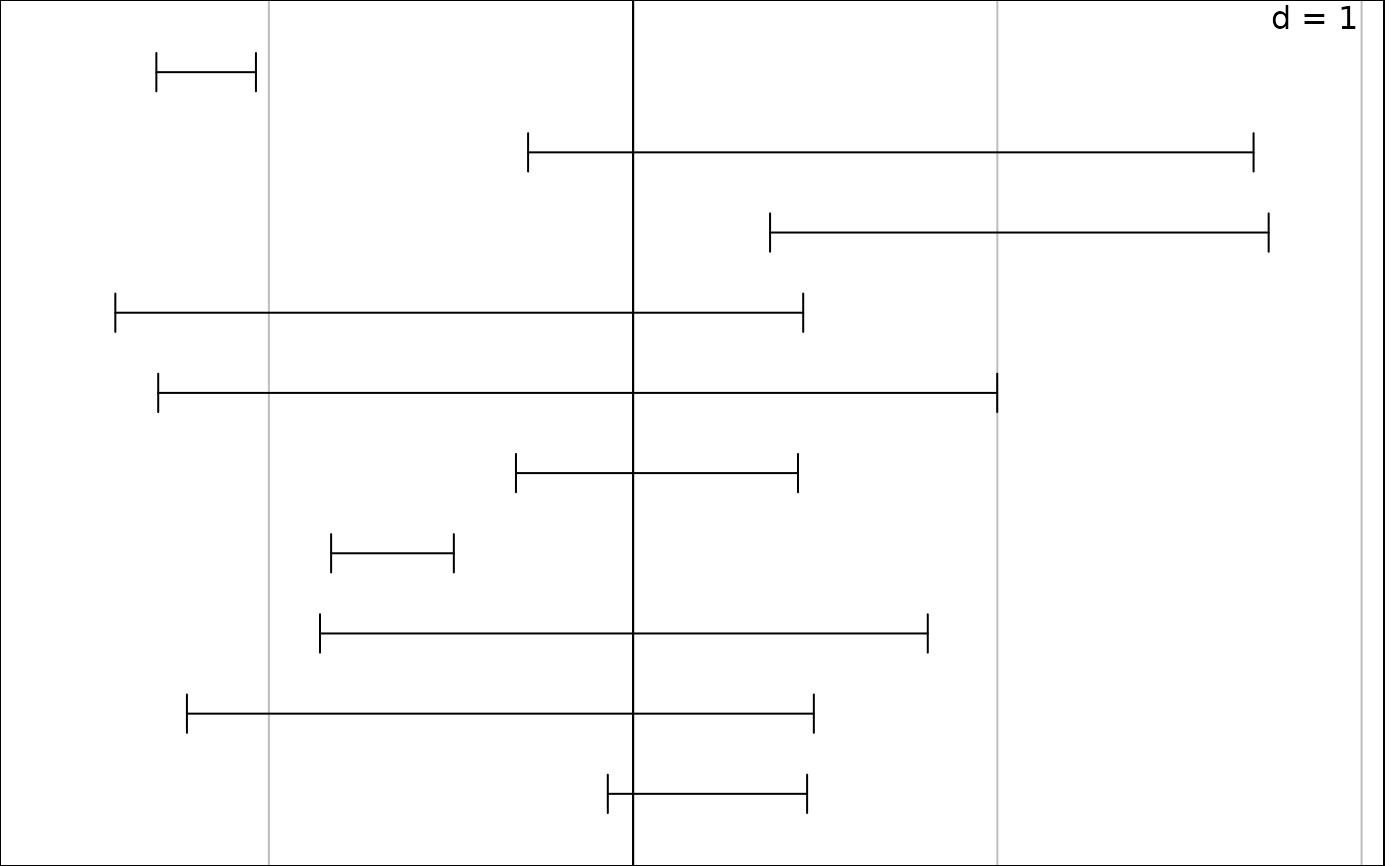
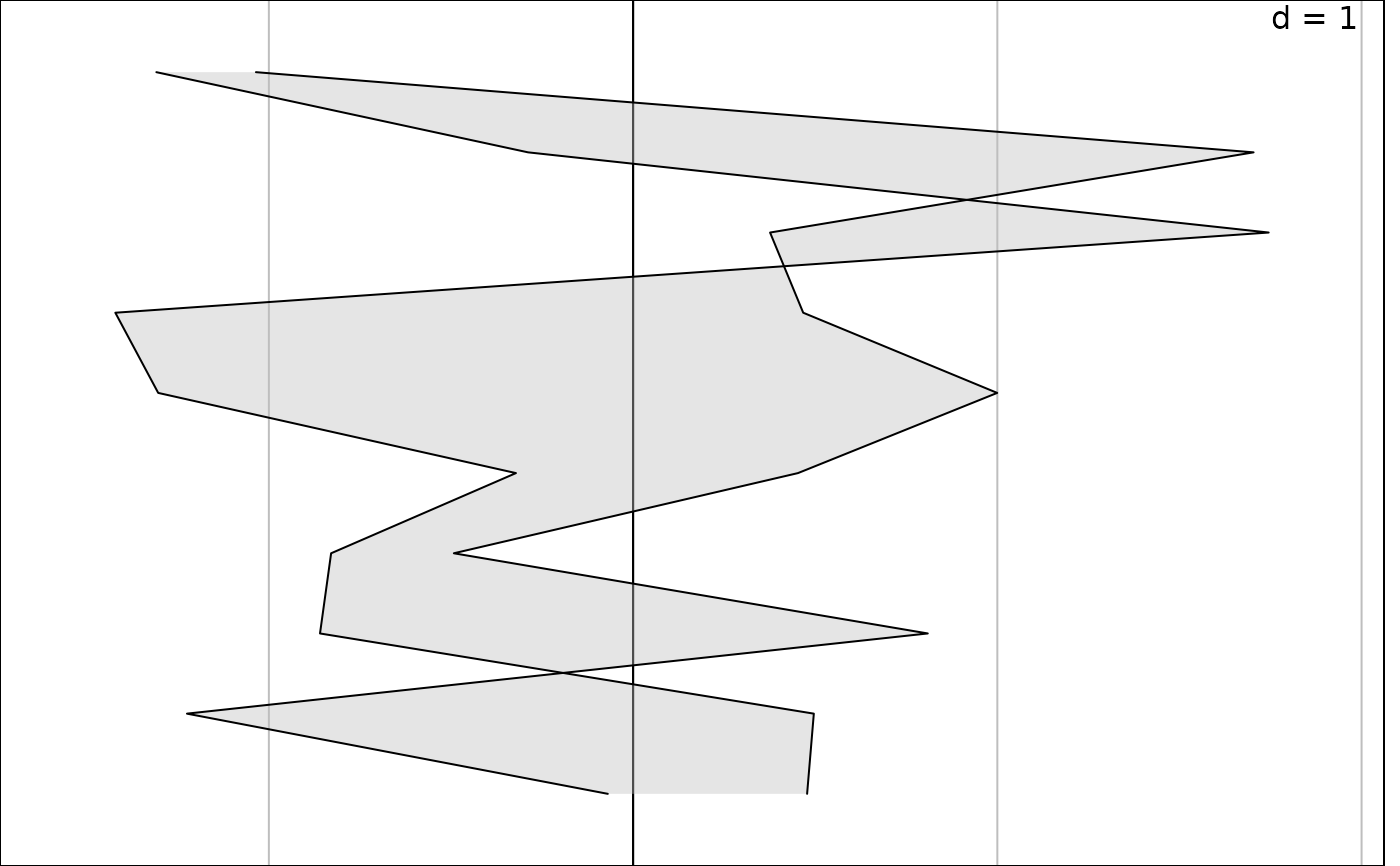
1-D plot of the interval between two numeric scores
s1d.interval.RdThis function represents the interval between two scores using either segments or filled areas.
Arguments
- score1
a numeric vector (or a data frame) used to produce the plot
- score2
a numeric vector with as many values as values (or rows) in
score1- at
a numeric vector used as an index
- method
a value,
barsorarea, to represent either segments or areasbetween scores.- facets
a factor splitting
scoreso that subsets of the data are represented on different sub-graphics- plot
a logical indicating if the graphics is displayed
- storeData
a logical indicating if the data are stored in the returned object. If
FALSE, only the names of the data arguments are stored- add
a logical. If
TRUE, the graphic is superposed to the graphics already plotted in the current device- pos
an integer indicating the position of the environment where the data are stored, relative to the environment where the function is called. Useful only if
storeDataisFALSE- ...
additional graphical parameters (see
adegparandtrellis.par.get)
Details
Graphical parameters for polygons, lines and segment boundaries are available in respectively
ppolygons, plines and parrows of adegpar.
Some appropriated graphical parameters in p1d are also available.
Value
An object of class ADEg (subclass C1.interval) or ADEgS (if add is TRUE and/or
if facets or data frame for score are used).
The result is displayed if plot is TRUE.
Author
Alice Julien-Laferriere, Aurelie Siberchicot aurelie.siberchicot@univ-lyon1.fr and Stephane Dray