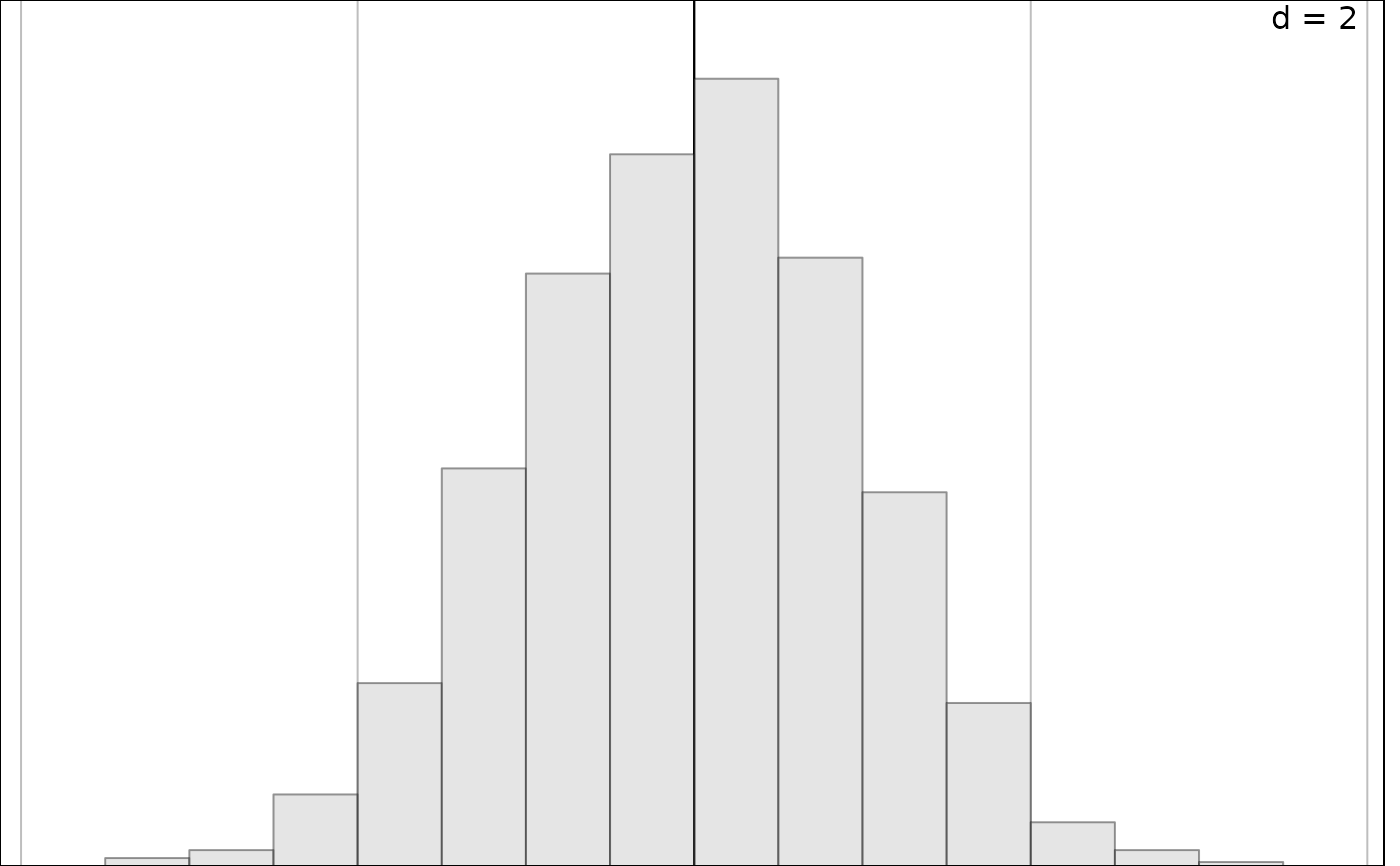
1-D plot of a numeric score by bars
s1d.hist.RdThis function represents a score using a chart with rectangular bars.
Arguments
- score
a numeric vector (or a data frame) used to produce the plot
- breaks
a vector of values to split
score. IfNULL,pretty(score, nclass)is used.- nclass
an integer for the number of desired intervals, ignored if
breaksis not missing.- type
a value among
count,density,percentto indicate the unit of the cell height.- right
a logical indicating if the histogram cells are right-closed (left open) intervals.
- facets
a factor splitting
scoreso that subsets of the data are represented on different sub-graphics- plot
a logical indicating if the graphics is displayed
- storeData
a logical indicating if the data are stored in the returned object. If
FALSE, only the names of the data arguments are stored- add
a logical. If
TRUE, the graphic is superposed to the graphics already plotted in the current device- pos
an integer indicating the position of the environment where the data are stored, relative to the environment where the function is called. Useful only if
storeDataisFALSE- ...
additional graphical parameters (see
adegparandtrellis.par.get)
Details
Graphical parameters for polygons are available in ppolygons of adegpar.
Some appropriated graphical parameters in p1d are also available.
Value
An object of class ADEg (subclass C1.hist) or ADEgS (if add is TRUE and/or
if facets or data frame for score are used).
The result is displayed if plot is TRUE.
Author
Alice Julien-Laferriere, Aurelie Siberchicot aurelie.siberchicot@univ-lyon1.fr and Stephane Dray