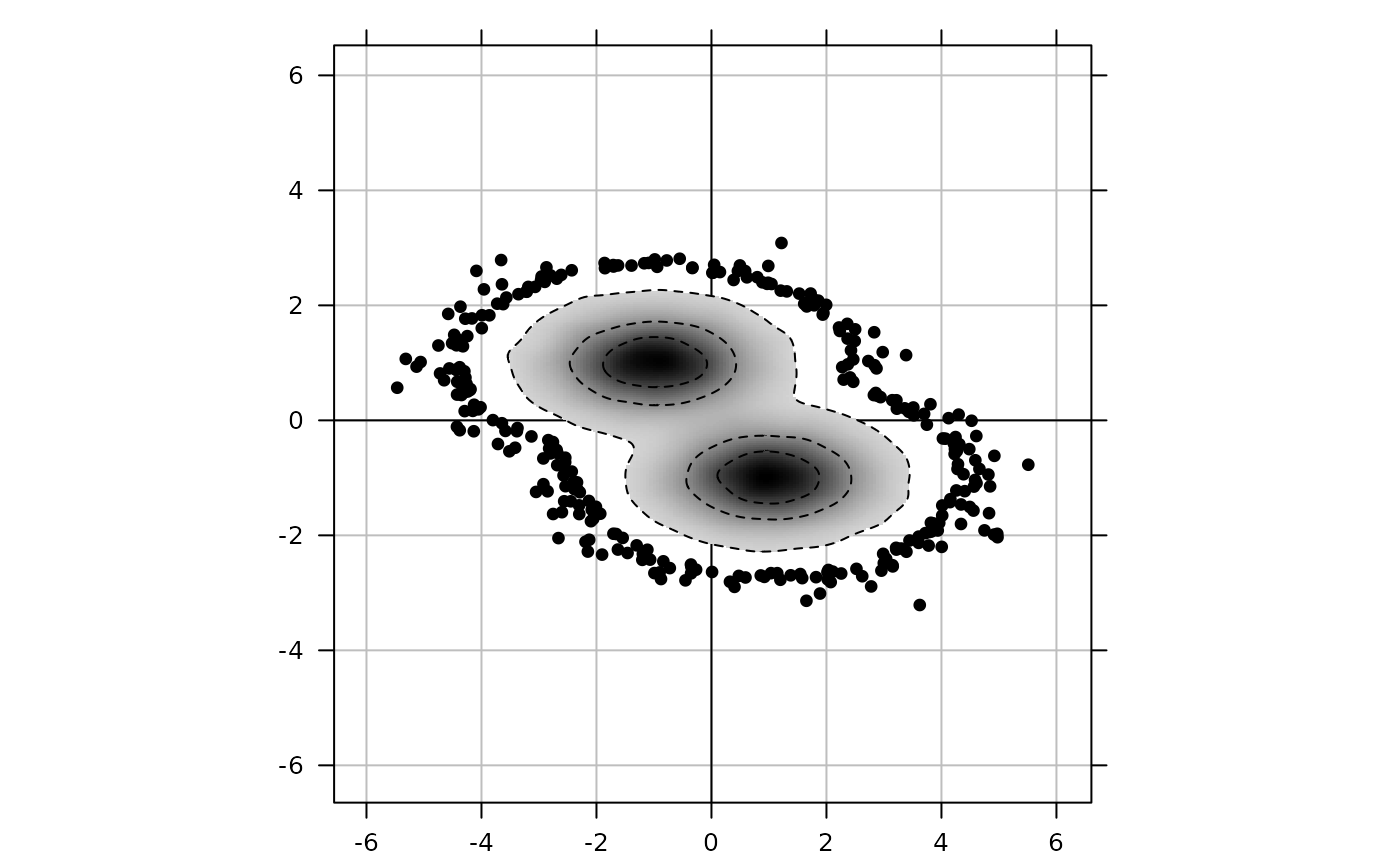
2-D scatter plot with kernel density estimation
s.density.RdThis function represents a two dimensional scatter plot of points distribution.
Densities' representation is based on the levelplot graphic in lattice
(density's surface, filled with colors and/or contour lines).
Usage
s.density(dfxy, xax = 1, yax = 2, bandwidth = NULL, gridsize = c(450L, 450L),
  nrpoints = 300, threshold = 0.1, col = NULL, contour = FALSE, region = !contour,
  nclass = 8, facets = NULL, plot = TRUE, storeData = TRUE, add = FALSE, pos = -1, ...)
Arguments
- dfxy
a data frame used to produce the plot
- xax
an integer (or a vector) indicating which column(s) of
dfxyis(are) plotted on the x-axis- yax
an integer (or a vector) indicating which column(s) of
dfxyis(are) plotted on the y-axis- bandwidth
bandwidth for density calculations which is passed in parameters in the
bkde2Dfunction of theKernSmoothpackage- gridsize
grid dimension
- nrpoints
number of points on the density image
- threshold
a value between 0 and 1 to draw densities greater than this threshold. No density is visible whether it is equal to 1
- col
a color or a colors vector to color densities
- contour
a logical to draw contour lines
- region
a logical to fill grid regions with
col- nclass
number of class for density
- facets
a factor splitting the rows of
dfxyso that subsets of the data are represented on different sub-graphics- plot
a logical indicating if the graphics is displayed
- storeData
a logical indicating if the data should be stored in the returned object. If
FALSE, only the names of the data arguments are stored- add
a logical. If
TRUE, the graphic is superposed to the graphics already plotted in the current device- pos
an integer indicating the position of the environment where the data are stored, relative to the environment where the function is called. Useful only if
storeDataisFALSE- ...
additional graphical parameters (see
adegparandtrellis.par.get)
Value
An object of class ADEg (subclass S2.density) or ADEgS (if add is TRUE and/or
if facets or vectors for xax/yax are used).
The result is displayed if plot is TRUE.
Author
Alice Julien-Laferriere, Aurelie Siberchicot aurelie.siberchicot@univ-lyon1.fr and Stephane Dray
Examples
xx2 <- c(rnorm(50000, 1, 1), rnorm(50000, -1, 1))
yy2 <- c(rnorm(50000, -1, 0.5), rnorm(50000, 1, 0.5))
s.density(cbind(xx2, yy2), paxes.draw = TRUE, gridsize = c(200, 200), region = TRUE,
  contour = TRUE, plabels.cex = 0, threshold = 0.05, nclass = 3,
  col = colorRampPalette(c("lightgrey", "black"))(100))