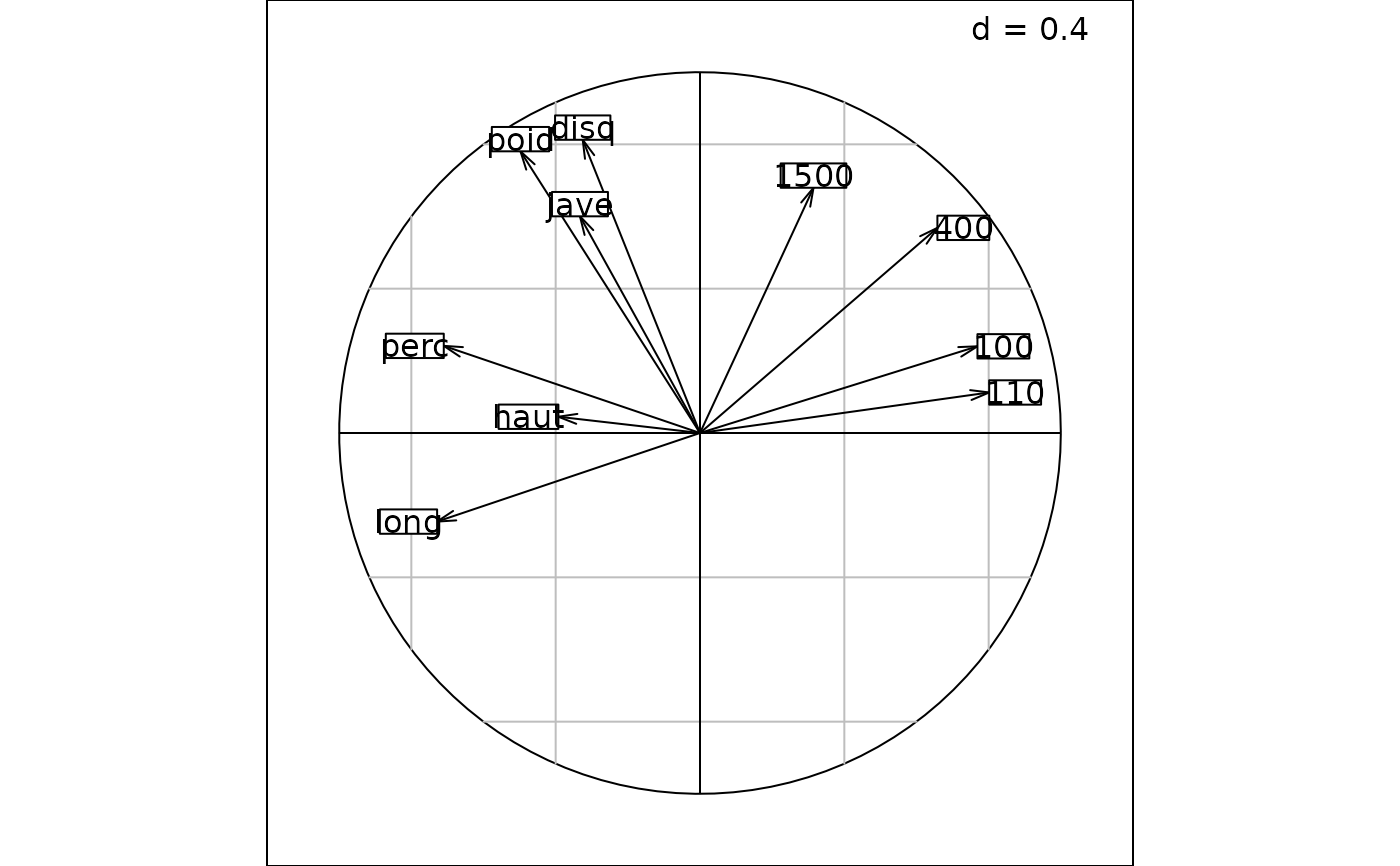
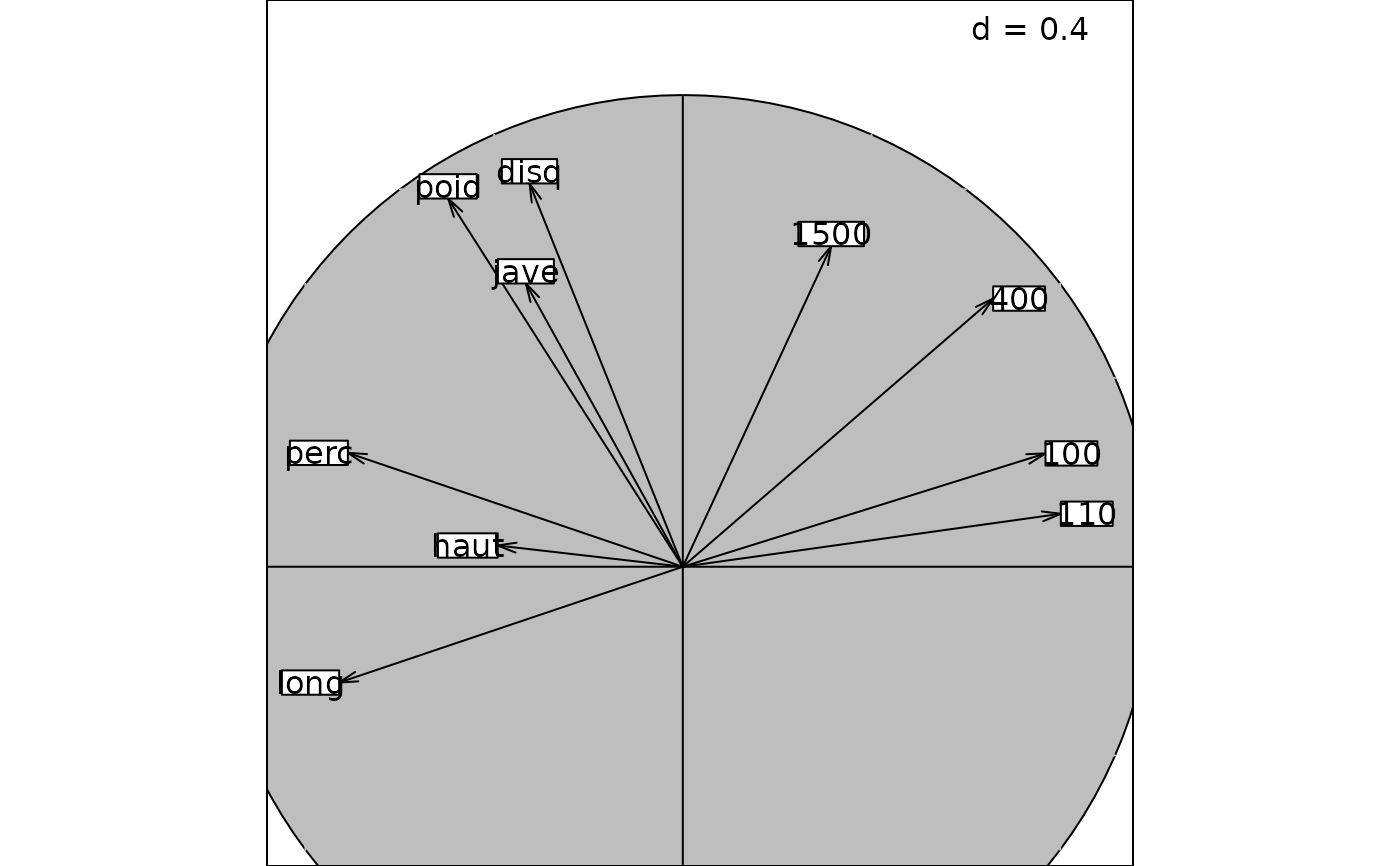
Correlation circle
s.corcircle.RdThis function produces a correlation circle.
Usage
s.corcircle(dfxy, xax = 1, yax = 2, labels = row.names(as.data.frame(dfxy)),
  fullcircle = TRUE, facets = NULL, plot = TRUE, storeData = TRUE,
  add = FALSE, pos = -1, ...)
Arguments
- dfxy
a data frame used to produce the plot
- labels
a vector containing the points' labels
- xax
an integer (or a vector) indicating which column(s) of
dfxyis(are) plotted on the x-axis- yax
an integer (or a vector) indicating which column(s) of
dfxyis(are) plotted on the y-axis- fullcircle
a logical to include the complete circle (limits are then c(-1, 1))
- facets
a factor splitting the rows of
dfxyso that subsets of the data are represented on different sub-graphics- plot
a logical indicating if the graphics is displayed
- storeData
a logical indicating if the data should be stored in the returned object. If
FALSE, only the names of the data arguments are stored- add
a logical. If
TRUE, the graphic is superposed to the graphics already plotted in the current device- pos
an integer indicating the position of the environment where the data are stored, relative to the environment where the function is called. Useful only if
storeDataisFALSE- ...
additional graphical parameters (see
adegparandtrellis.par.get)
Value
An object of class ADEg (subclass S2.corcircle) or ADEgS (if add is TRUE and/or
if facets or vectors for xax/yax are used).
The result is displayed if plot is TRUE.
Author
Alice Julien-Laferriere, Aurelie Siberchicot aurelie.siberchicot@univ-lyon1.fr and Stephane Dray