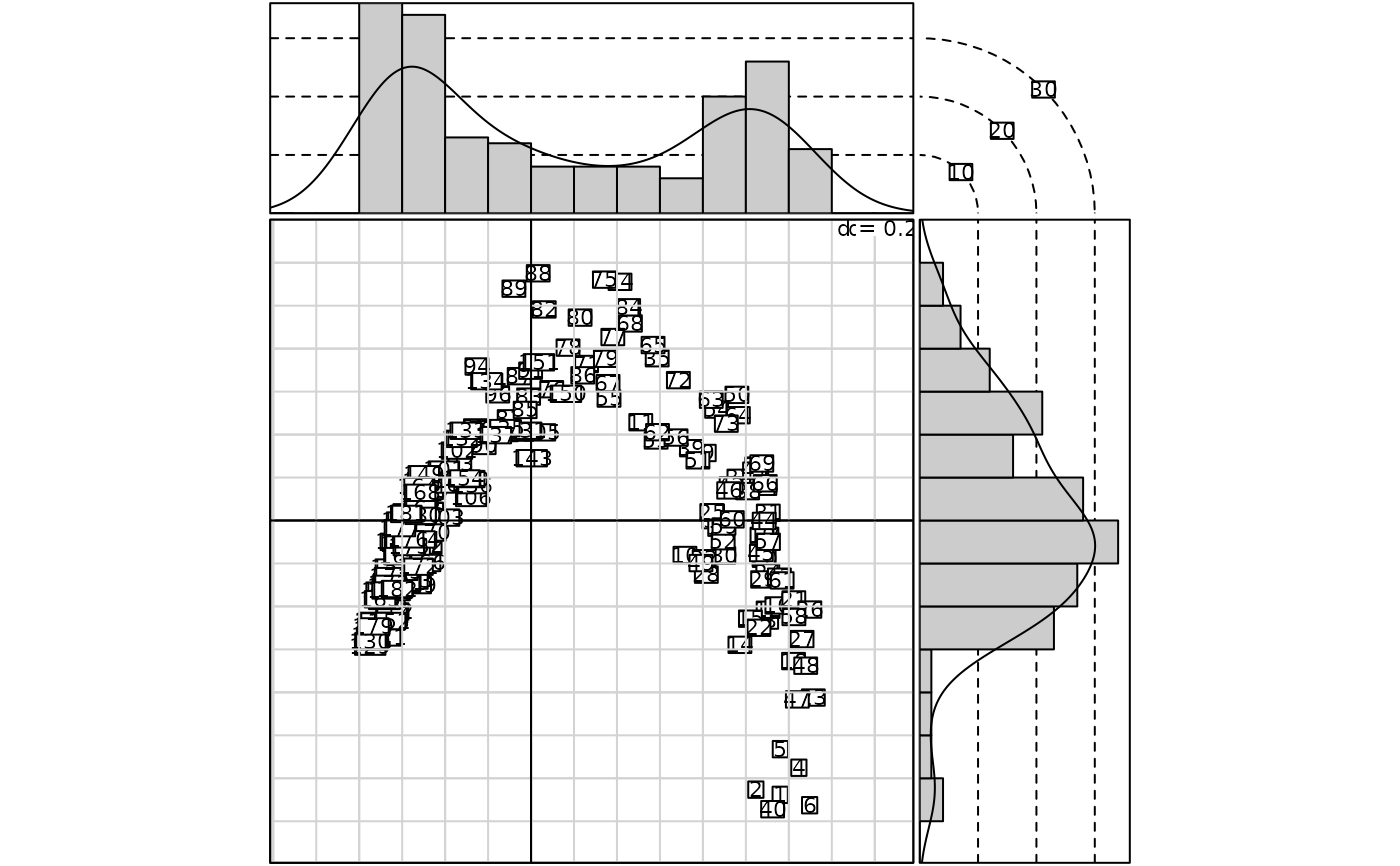
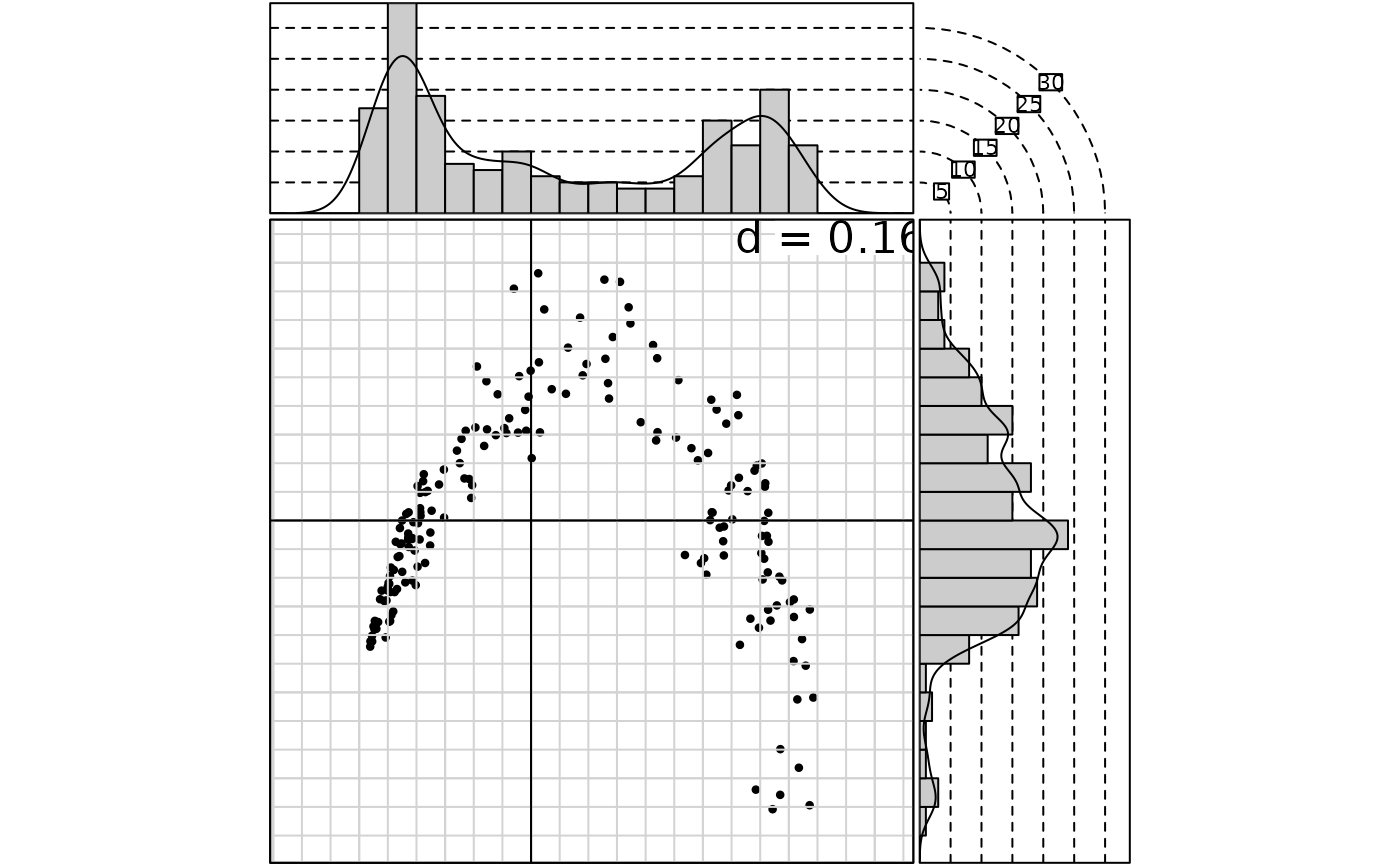
Display of a scatterplot and its two marginal histograms
s.hist.Rdperforms a scatterplot and the two marginal histograms of each axis.
Arguments
- dfxy
a data frame with two coordinates
- xax
column for the x axis
- yax
column for the y axis
- cgrid
a character size, parameter used with
par("cex")*cgridto indicate the mesh of the grid- cbreaks
a parameter used to define the numbers of cells for the histograms. By default, two cells are defined for each interval of the grid displayed in
s.label. With an increase of the integercbreaks, the number of cells increases as well.- adjust
a parameter passed to
densityto display a kernel density estimation- ...
further arguments passed from the
s.labelfor the scatter plot