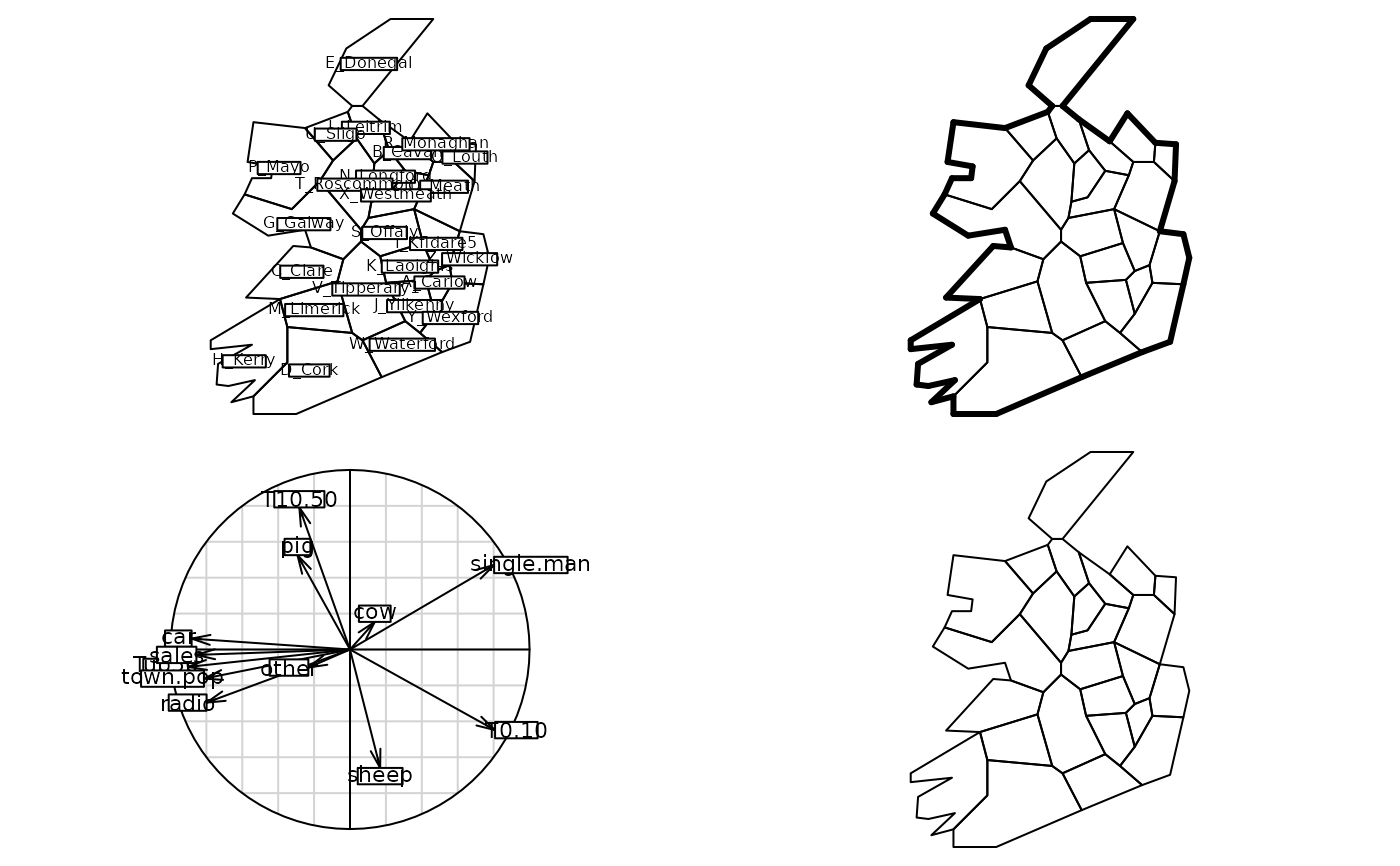
Geary's Irish Data
irishdata.RdThis data set contains geographical informations about 25 counties of Ireland.
Usage
data(irishdata)Format
irishdata is a list of 13 components:
- area
a data frame with polygons for each of the 25 contiguous counties
- county.names
a vector with the names of the 25 counties
- xy
a data frame with the coordinates centers of the 25 counties
- tab
a data frame with 25 rows (counties) and 12 variables
- contour
a data frame with the global polygon of all the 25 counties
- link
a matrix containing the common length between two counties from
area- area.utm
a data frame with polygons for each of the 25 contiguous counties expressed in Universal Transverse Mercator (UTM) coordinates
- xy.utm
a data frame with the UTM coordinates centers of the 25 counties
- link.utm
a matrix containing the common length between two counties from
area.utm- tab.utm
a data frame with the 25 counties (explicitly named) and 12 variables
- contour.utm
a data frame with the global polygon of all the 25 counties expressed in UTM coordinates
- Spatial
the map of the 25 counties of Ireland (an object of the class
SpatialPolygonsofsp)- Spatial.contour
the contour of the map of the 25 counties of Ireland (an object of the class
SpatialPolygonsofsp)
Source
Geary, R.C. (1954) The contiguity ratio and statistical mapping. The incorporated Statistician, 5, 3, 115–145.
Cliff, A.D. and Ord, J.K. (1973) Spatial autocorrelation, Pion, London. 1–178.
Examples
data(irishdata)

if(adegraphicsLoaded()) {

  if(requireNamespace("sp", quietly = TRUE)){
  g1 <- s.label(irishdata$xy.utm, Sp = irishdata$Spatial, pSp.col = "white", plot = FALSE)

  g21 <- s.label(irishdata$xy.utm, Sp = irishdata$Spatial, pSp.col = "white", plab.cex = 0,
    ppoints.cex = 0, plot = FALSE)
  g22 <- s.label(irishdata$xy.utm, Sp = irishdata$Spatial.contour, pSp.col = "transparent",
    plab.cex = 0, ppoints.cex = 0, pSp.lwd = 3, plot = FALSE)
  g2 <- superpose(g21, g22)

  g3 <- s.corcircle(dudi.pca(irishdata$tab, scan = FALSE)$co, plot = FALSE)

  score <- dudi.pca(irishdata$tab, scannf = FALSE, nf = 1)$li$Axis1
  names(score) <- row.names(irishdata$Spatial)

  obj <- sp::SpatialPolygonsDataFrame(Sr = irishdata$Spatial, data = as.data.frame(score))
  g4 <- s.Spatial(obj, plot = FALSE)

  G <- ADEgS(list(g1, g2, g3, g4), layout = c(2, 2))
  }

} else {
  par(mfrow = c(2, 2))
  area.plot(irishdata$area, lab = irishdata$county.names, clab = 0.75)
  area.plot(irishdata$area)
  apply(irishdata$contour, 1, function(x) segments(x[1], x[2], x[3], x[4], lwd = 3))
  s.corcircle(dudi.pca(irishdata$tab, scannf = FALSE)$co)
  score <- dudi.pca(irishdata$tab, scannf = FALSE, nf = 1)$li$Axis1
  names(score) <- row.names(irishdata$tab)
  area.plot(irishdata$area, score)
  par(mfrow = c(1, 1))
}