Distance Matrices
yanomama.RdThis data set gives 3 matrices about geographical, genetic and anthropometric distances.
Usage
data(yanomama)Format
yanomama is a list of 3 components:
- geo
is a matrix of 19-19 geographical distances
- gen
is a matrix of 19-19 SFA (genetic) distances
- ant
is a matrix of 19-19 anthropometric distances
Source
Spielman, R.S. (1973) Differences among Yanomama Indian villages: do the patterns of allele frequencies, anthropometrics and map locations correspond? American Journal of Physical Anthropology, 39, 461–480.
References
Table 7.2 Distance matrices for 19 villages of Yanomama Indians. All distances are as given by Spielman (1973), multiplied by 100 for convenience in: Manly, B.F.J. (1991) Randomization and Monte Carlo methods in biology Chapman and Hall, London, 1–281.
Examples
data(yanomama)
gen <- quasieuclid(as.dist(yanomama$gen)) # depends of mva
ant <- quasieuclid(as.dist(yanomama$ant)) # depends of mva
par(mfrow = c(2,2))
plot(gen, ant)
t1 <- mantel.randtest(gen, ant, 99);
plot(t1, main = "gen-ant-mantel") ; print(t1)
#> Monte-Carlo test
#> Call: mantel.randtest(m1 = gen, m2 = ant, nrepet = 99)
#>
#> Observation: 0.2999879
#>
#> Based on 99 replicates
#> Simulated p-value: 0.04
#> Alternative hypothesis: greater
#>
#> Std.Obs Expectation Variance
#> 1.827914868 -0.008470837 0.028476213
t1 <- procuste.rtest(pcoscaled(gen), pcoscaled(ant), 99)
plot(t1, main = "gen-ant-procuste") ; print(t1)
#> Monte-Carlo test
#> Call: procuste.rtest(df1 = pcoscaled(gen), df2 = pcoscaled(ant), nrepet = 99)
#>
#> Observation: 0.6819023
#>
#> Based on 99 replicates
#> Simulated p-value: 0.01
#> Alternative hypothesis: greater
#>
#> Std.Obs Expectation Variance
#> 3.396865708 0.541544013 0.001707338
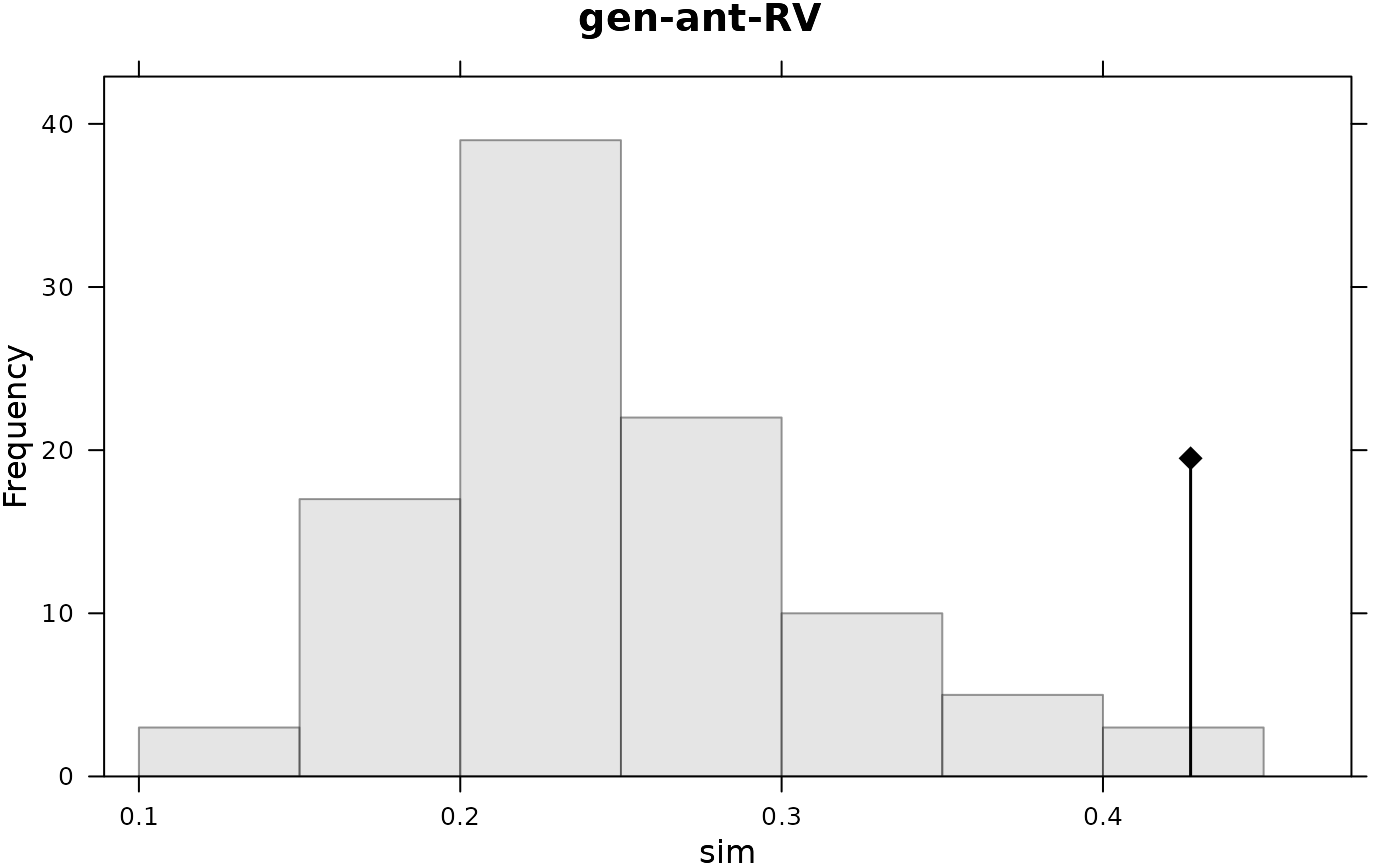
t1 <- RV.rtest(pcoscaled(gen), pcoscaled(ant), 99)
plot(t1, main = "gen-ant-RV") ; print(t1)
#> Monte-Carlo test
#> Call: RV.rtest(df1 = pcoscaled(gen), df2 = pcoscaled(ant), nrepet = 99)
#>
#> Observation: 0.4272698
#>
#> Based on 99 replicates
#> Simulated p-value: 0.03
#> Alternative hypothesis: greater
#>
#> Std.Obs Expectation Variance
#> 2.751980726 0.253456163 0.003989118