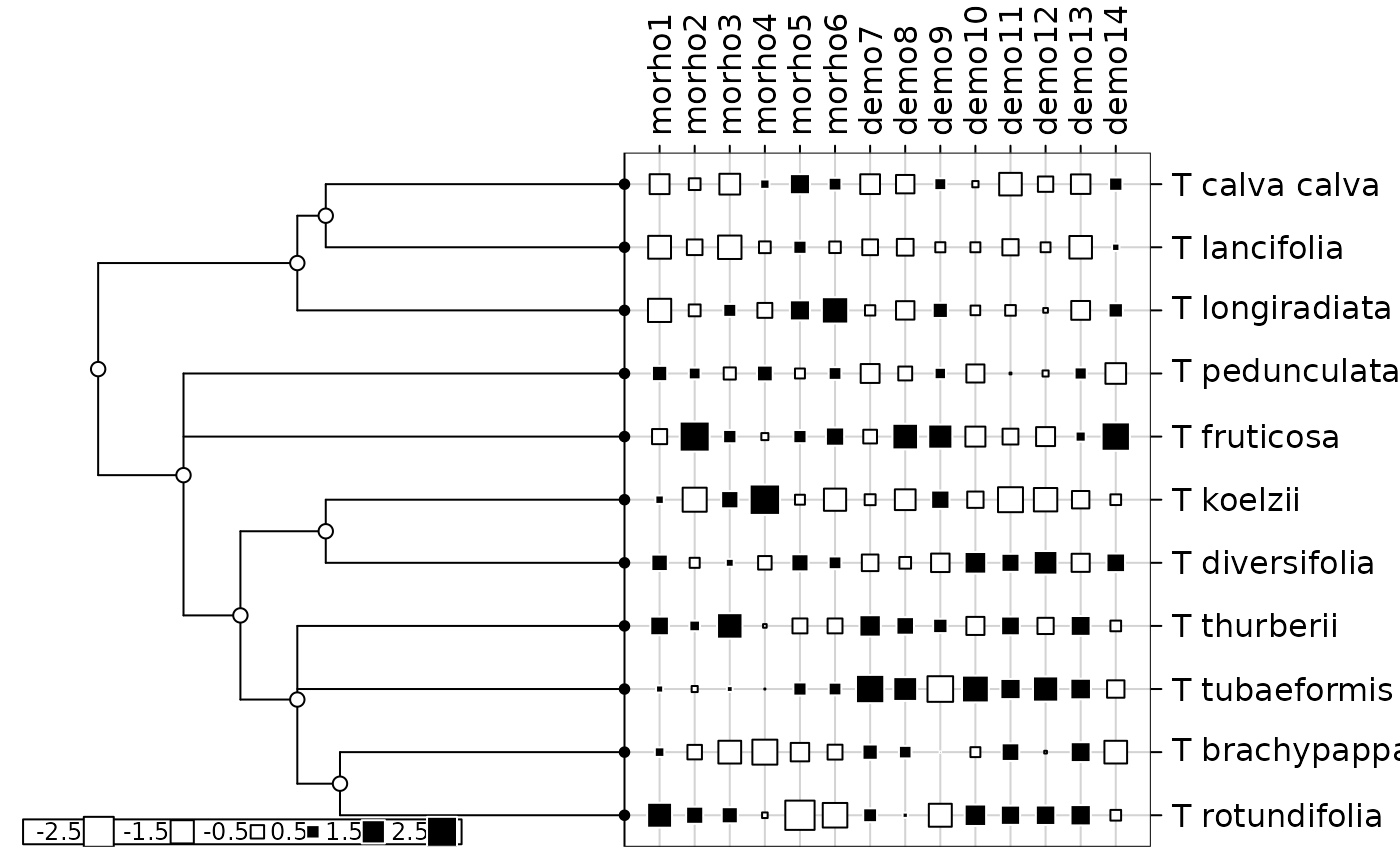
Phylogeny and quantitative traits of flowers
tithonia.RdThis data set describes the phylogeny of 11 flowers as reported by Morales (2000). It also gives morphologic and demographic traits corresponding to these 11 species.
Usage
data(tithonia)Format
tithonia is a list containing the 2 following objects :
- tre
is a character string giving the phylogenetic tree in Newick format.
- tab
is a data frame with 11 species and 14 traits (6 morphologic traits and 8 demographic).
Details
Variables of tithonia$tab are the following ones :
morho1: is a numeric vector that describes the seed size (mm)
morho2: is a numeric vector that describes the flower size (mm)
morho3: is a numeric vector that describes the female leaf size (cm)
morho4: is a numeric vector that describes the head size (mm)
morho5: is a integer vector that describes the number of flowers per head
morho6: is a integer vector that describes the number of seeds per head
demo7: is a numeric vector that describes the seedling height (cm)
demo8: is a numeric vector that describes the growth rate (cm/day)
demo9: is a numeric vector that describes the germination time
demo10: is a numeric vector that describes the establishment (per cent)
demo11: is a numeric vector that describes the viability (per cent)
demo12: is a numeric vector that describes the germination (per cent)
demo13: is a integer vector that describes the resource allocation
demo14: is a numeric vector that describes the adult height (m)
Source
Data were obtained from Morales, E. (2000) Estimating phylogenetic inertia in Tithonia (Asteraceae) : a comparative approach. Evolution, 54, 2, 475–484.
Examples
data(tithonia)
phy <- newick2phylog(tithonia$tre)
tab <- log(tithonia$tab + 1)
table.phylog(scalewt(tab), phy)

gearymoran(phy$Wmat, tab)
#> class: krandtest lightkrandtest
#> Monte-Carlo tests
#> Call: as.krandtest(sim = matrix(res$result, ncol = nvar, byrow = TRUE),
#>     obs = res$obs, alter = alter, names = test.names)
#>
#> Number of tests:   14
#>
#> Adjustment method for multiple comparisons:   none
#> Permutation number:   999
#>      Test       Obs    Std.Obs   Alter Pvalue
#> 1  morho1 0.7321356  4.4427417 greater  0.004
#> 2  morho2 0.3822949  0.3498091 greater  0.320
#> 3  morho3 0.3712126  0.3118137 greater  0.263
#> 4  morho4 0.2572795 -0.9311740 greater  0.789
#> 5  morho5 0.4457180  1.1598022 greater  0.120
#> 6  morho6 0.4089212  0.7963224 greater  0.167
#> 7   demo7 0.4416215  1.1968312 greater  0.091
#> 8   demo8 0.4822195  1.7202482 greater  0.065
#> 9   demo9 0.3043863 -0.4473044 greater  0.631
#> 10 demo10 0.2744296 -0.7843237 greater  0.808
#> 11 demo11 0.4458932  1.2906286 greater  0.104
#> 12 demo12 0.2640213 -0.9073976 greater  0.864
#> 13 demo13 0.6092138  3.5112447 greater  0.004
#> 14 demo14 0.3903768  0.4885546 greater  0.242
#>
gearymoran(phy$Amat, tab)
#> class: krandtest lightkrandtest
#> Monte-Carlo tests
#> Call: as.krandtest(sim = matrix(res$result, ncol = nvar, byrow = TRUE),
#>     obs = res$obs, alter = alter, names = test.names)
#>
#> Number of tests:   14
#>
#> Adjustment method for multiple comparisons:   none
#> Permutation number:   999
#>      Test         Obs     Std.Obs   Alter Pvalue
#> 1  morho1  0.53784586  2.95709481 greater  0.006
#> 2  morho2  0.10046720  0.59268450 greater  0.280
#> 3  morho3  0.07014773  0.40817620 greater  0.325
#> 4  morho4 -0.09223746 -0.59356172 greater  0.768
#> 5  morho5  0.35119692  2.20027965 greater  0.024
#> 6  morho6  0.17659490  1.12524178 greater  0.141
#> 7   demo7  0.44981278  2.59234126 greater  0.011
#> 8   demo8  0.25528857  1.44537595 greater  0.085
#> 9   demo9 -0.01050264 -0.08526142 greater  0.493
#> 10 demo10 -0.09660405 -0.57276585 greater  0.676
#> 11 demo11  0.26985310  1.43831652 greater  0.092
#> 12 demo12 -0.19861554 -1.13430360 greater  0.874
#> 13 demo13  0.63572312  3.36426413 greater  0.003
#> 14 demo14  0.05085783  0.32000782 greater  0.356
#>
gearymoran(phy$Wmat, tab)
#> class: krandtest lightkrandtest
#> Monte-Carlo tests
#> Call: as.krandtest(sim = matrix(res$result, ncol = nvar, byrow = TRUE),
#> obs = res$obs, alter = alter, names = test.names)
#>
#> Number of tests: 14
#>
#> Adjustment method for multiple comparisons: none
#> Permutation number: 999
#> Test Obs Std.Obs Alter Pvalue
#> 1 morho1 0.7321356 4.4427417 greater 0.004
#> 2 morho2 0.3822949 0.3498091 greater 0.320
#> 3 morho3 0.3712126 0.3118137 greater 0.263
#> 4 morho4 0.2572795 -0.9311740 greater 0.789
#> 5 morho5 0.4457180 1.1598022 greater 0.120
#> 6 morho6 0.4089212 0.7963224 greater 0.167
#> 7 demo7 0.4416215 1.1968312 greater 0.091
#> 8 demo8 0.4822195 1.7202482 greater 0.065
#> 9 demo9 0.3043863 -0.4473044 greater 0.631
#> 10 demo10 0.2744296 -0.7843237 greater 0.808
#> 11 demo11 0.4458932 1.2906286 greater 0.104
#> 12 demo12 0.2640213 -0.9073976 greater 0.864
#> 13 demo13 0.6092138 3.5112447 greater 0.004
#> 14 demo14 0.3903768 0.4885546 greater 0.242
#>
gearymoran(phy$Amat, tab)
#> class: krandtest lightkrandtest
#> Monte-Carlo tests
#> Call: as.krandtest(sim = matrix(res$result, ncol = nvar, byrow = TRUE),
#> obs = res$obs, alter = alter, names = test.names)
#>
#> Number of tests: 14
#>
#> Adjustment method for multiple comparisons: none
#> Permutation number: 999
#> Test Obs Std.Obs Alter Pvalue
#> 1 morho1 0.53784586 2.95709481 greater 0.006
#> 2 morho2 0.10046720 0.59268450 greater 0.280
#> 3 morho3 0.07014773 0.40817620 greater 0.325
#> 4 morho4 -0.09223746 -0.59356172 greater 0.768
#> 5 morho5 0.35119692 2.20027965 greater 0.024
#> 6 morho6 0.17659490 1.12524178 greater 0.141
#> 7 demo7 0.44981278 2.59234126 greater 0.011
#> 8 demo8 0.25528857 1.44537595 greater 0.085
#> 9 demo9 -0.01050264 -0.08526142 greater 0.493
#> 10 demo10 -0.09660405 -0.57276585 greater 0.676
#> 11 demo11 0.26985310 1.43831652 greater 0.092
#> 12 demo12 -0.19861554 -1.13430360 greater 0.874
#> 13 demo13 0.63572312 3.36426413 greater 0.003
#> 14 demo14 0.05085783 0.32000782 greater 0.356
#>