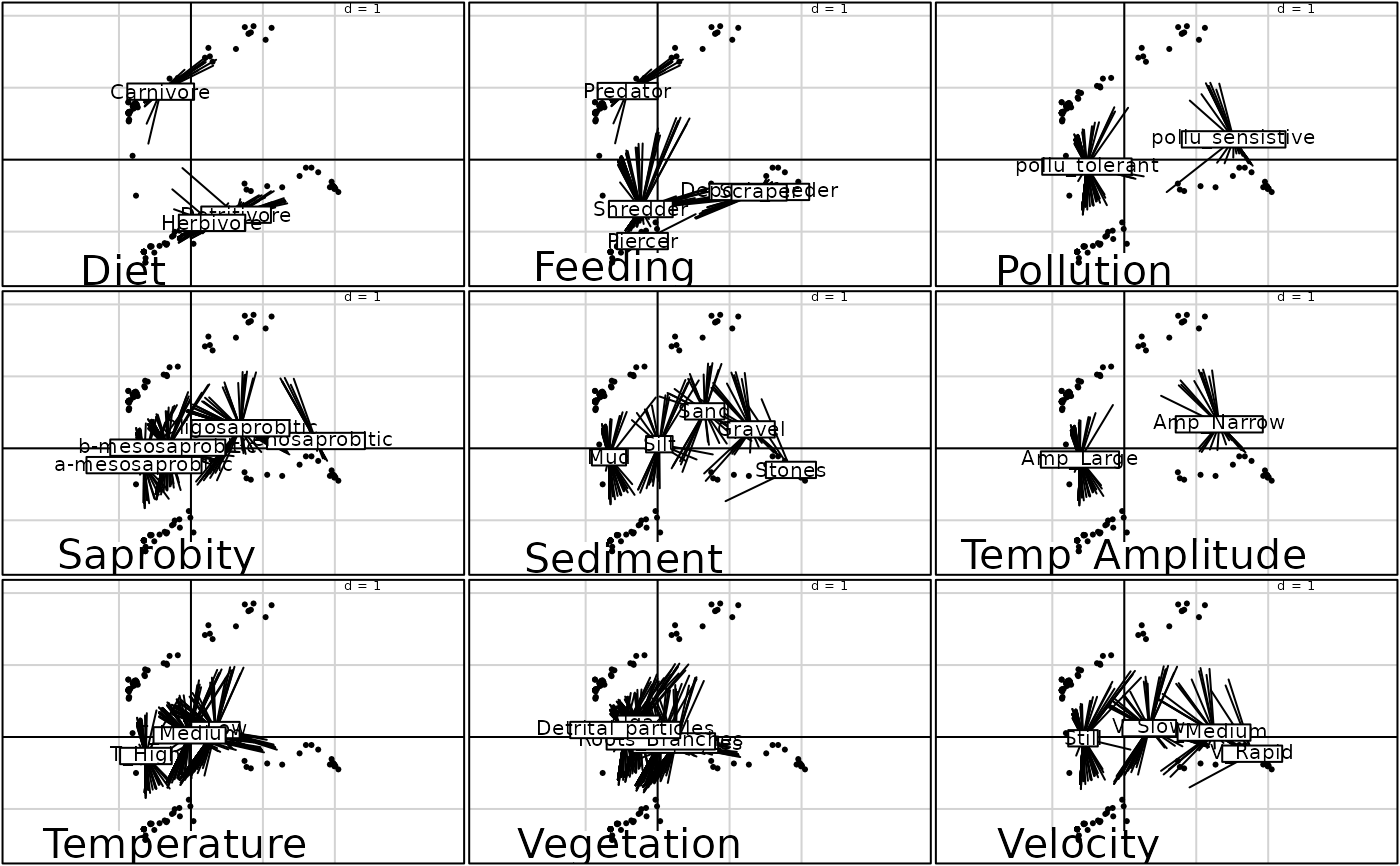
Plot of the factorial maps for a fuzzy correspondence analysis
scatter.fca.Rdperforms the scatter diagrams of a fuzzy correspondence analysis.
Arguments
- x
an object of class
fca- xax
the column number for the x-axis
- yax
the column number for the y-axis
- clab.moda
the character size to write the modalities
- labels
a vector of strings of characters for the labels of the modalities
- sub
a vector of strings of characters to be inserted as legend in each figure
- csub
a character size for the legend, used with
par("cex")*csub- ...
further arguments passed to or from other methods
References
Chevenet, F., Dolédec, S. and Chessel, D. (1994) A fuzzy coding approach for the analysis of long-term ecological data. Freshwater Biology, 31, 295–309.
Examples
data(coleo)
coleo.fuzzy <- prep.fuzzy.var(coleo$tab, coleo$col.blocks)
#> 2 missing data found in block 1
#> 1 missing data found in block 3
#> 2 missing data found in block 4
fca1 <- dudi.fca(coleo.fuzzy, sca = FALSE, nf = 3)

if(adegraphicsLoaded()) {
  plot(fca1)
} else {
  scatter(fca1, labels = coleo$moda.names, clab.moda = 1.5,
    sub = names(coleo$col.blocks), csub = 3)
}
