Phylogeny and quantitative traits of flowers
maples.RdThis data set describes the phylogeny of 17 flowers as reported by Ackerly and Donoghue (1998). It also gives 31 traits corresponding to these 17 species.
Usage
data(maples)Format
tithonia is a list containing the 2 following objects :
- tre
is a character string giving the phylogenetic tree in Newick format.
- tab
is a data frame with 17 species and 31 traits
References
Ackerly, D. D. and Donoghue, M.J. (1998) Leaf size, sapling allometry, and Corner's rules: phylogeny and correlated evolution in Maples (Acer). American Naturalist, 152, 767--791.
Examples
data(maples)
phy <- newick2phylog(maples$tre)
dom <- maples$tab$Dom
bif <- maples$tab$Bif
if (requireNamespace("adephylo", quietly = TRUE) & requireNamespace("ape", quietly = TRUE)) {
phylo <- ape::read.tree(text = maples$tre)
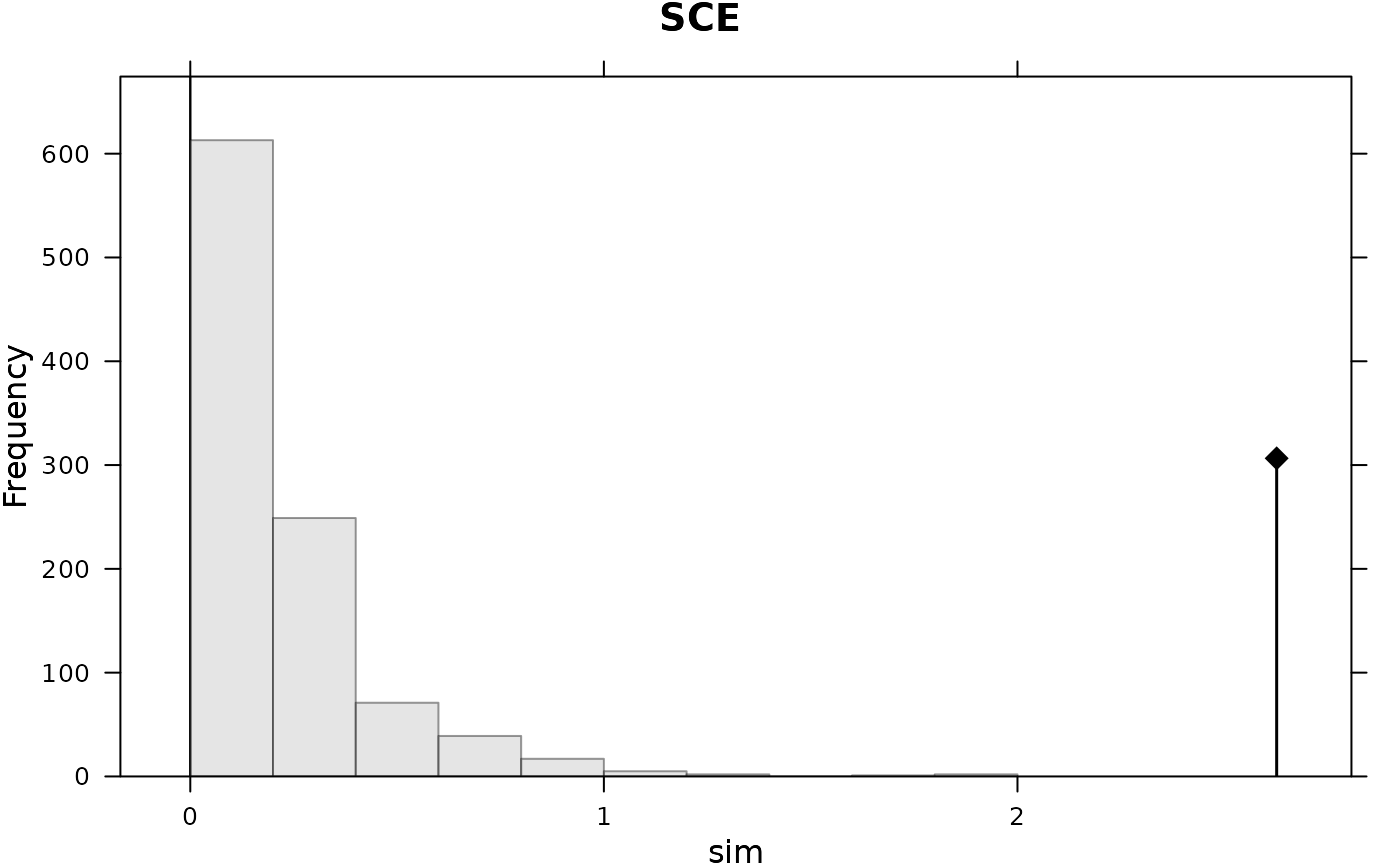
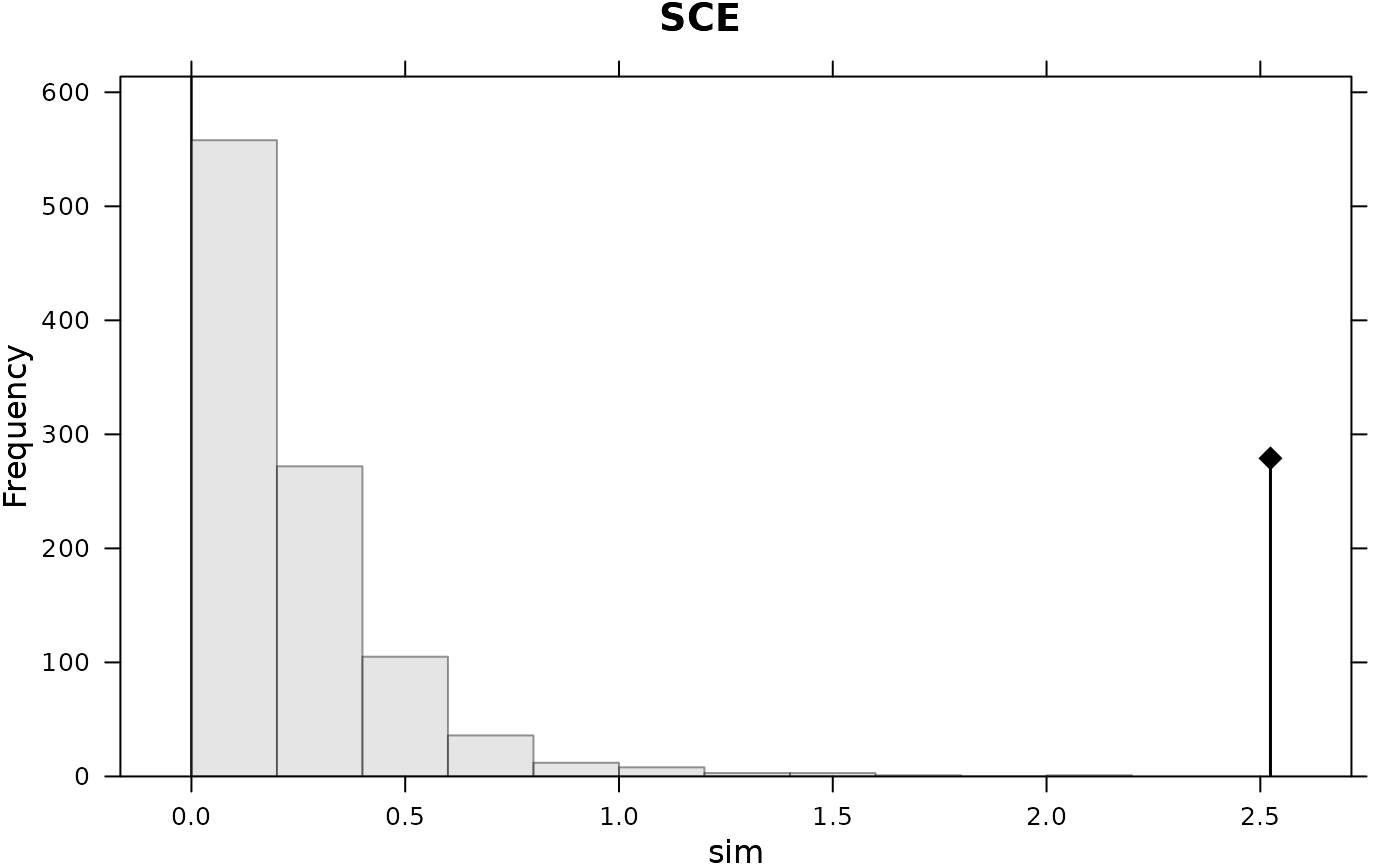
adephylo::orthogram(dom, tre = phylo)
adephylo::orthogram(bif, tre = phylo)
par(mfrow = c(1, 2))
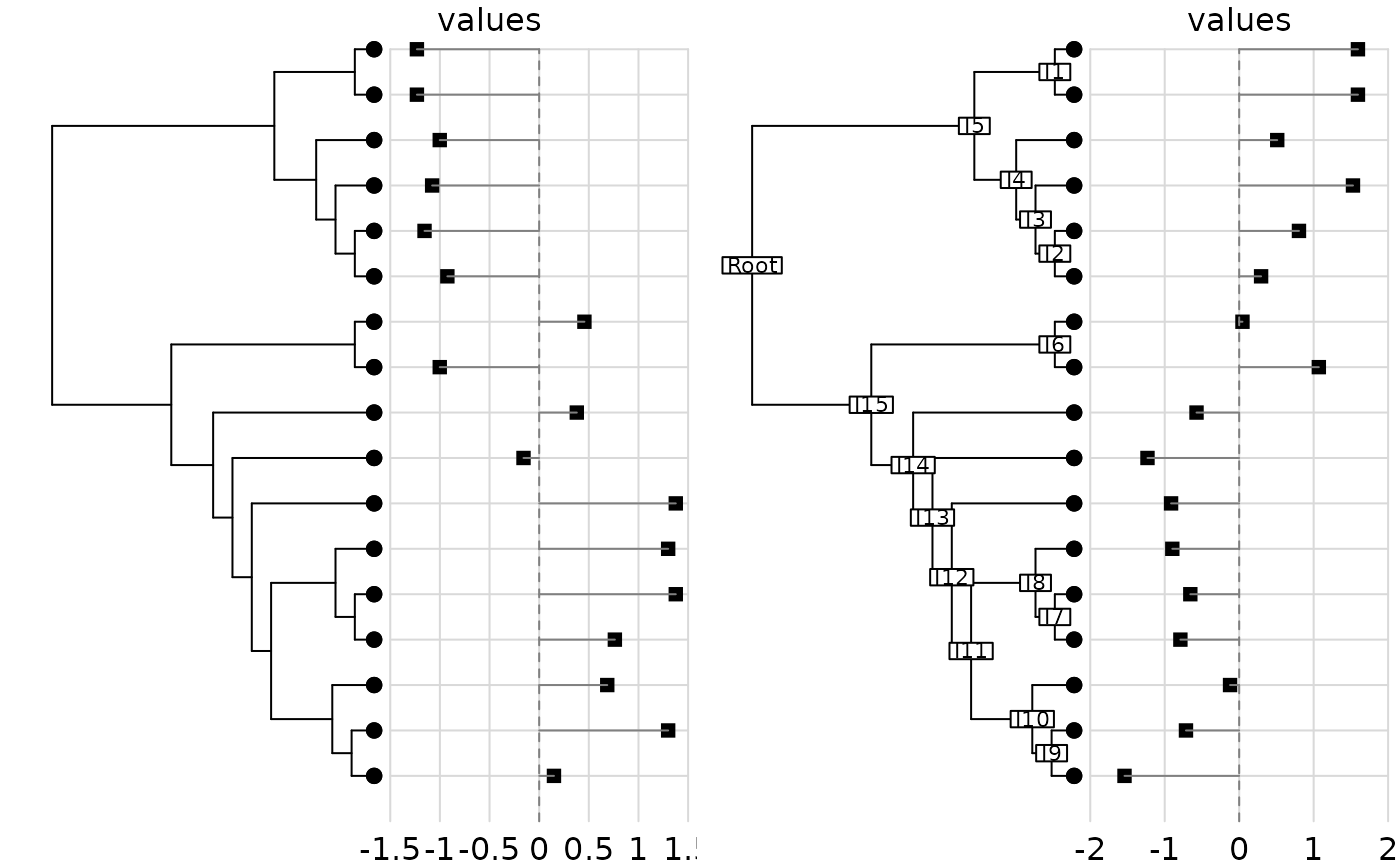
dotchart.phylog(phy, dom)
dotchart.phylog(phy, bif, clabel.nodes = 0.7)
par(mfrow = c(1, 1))
plot(bif, dom, pch = 20)
abline(lm(dom~bif))
summary(lm(dom~bif))
cor.test(bif, dom)
pic.bif <- ape::pic(bif, phylo)
pic.dom <- ape::pic(dom, phylo)
cor.test(pic.bif, pic.dom)
}
 #>
#> Pearson's product-moment correlation
#>
#> data: pic.bif and pic.dom
#> t = -1.5823, df = 14, p-value = 0.1359
#> alternative hypothesis: true correlation is not equal to 0
#> 95 percent confidence interval:
#> -0.7419510 0.1316186
#> sample estimates:
#> cor
#> -0.3894993
#>
#>
#> Pearson's product-moment correlation
#>
#> data: pic.bif and pic.dom
#> t = -1.5823, df = 14, p-value = 0.1359
#> alternative hypothesis: true correlation is not equal to 0
#> 95 percent confidence interval:
#> -0.7419510 0.1316186
#> sample estimates:
#> cor
#> -0.3894993
#>