Transformation of K distance matrices (object 'kdist') into K Euclidean representations (object 'ktab')
kdist2ktab.RdThe function creates a ktab object with the Euclidean representations from a kdist object. Notice that the euclid attribute must be TRUE for all elements.
Value
returns a list of class ktab containing for each distance of kd the data frame of its Euclidean representation
Author
Daniel Chessel
Anne-Béatrice Dufour anne-beatrice.dufour@univ-lyon1.fr
Examples
data(friday87)
fri.w <- ktab.data.frame(friday87$fau, friday87$fau.blo, tabnames = friday87$tab.names)
fri.kd <- lapply(1:10, function(x) dist.binary(fri.w[[x]], 10))
names(fri.kd) <- substr(friday87$tab.names, 1, 4)
fri.kd <- kdist(fri.kd)
#> Warning: Zero distance(s)
fri.ktab <- kdist2ktab(kd = fri.kd)
fri.sepan <- sepan(fri.ktab)
plot(fri.sepan)
#> Error in plot.sepan(fri.sepan): object 'fri.sepan' not found
tapply(fri.sepan$Eig, fri.sepan$TC[,1], sum)
#> Hemi Odon Tric Ephe Cole Dipt Hydr Mala Moll Olig
#> 1 1 1 1 1 1 1 1 1 1
# the sum of the eigenvalues is constant and equal to 1, for each K tables
fri.statis <- statis(fri.ktab, scan = FALSE, nf = 2)
round(fri.statis$RV, dig = 2)
#> Hemi Odon Tric Ephe Cole Dipt Hydr Mala Moll Olig
#> Hemi 1.00 0.84 0.89 0.72 0.93 0.91 0.94 0.87 0.90 0.87
#> Odon 0.84 1.00 0.86 0.71 0.86 0.88 0.85 0.83 0.87 0.81
#> Tric 0.89 0.86 1.00 0.82 0.93 0.93 0.91 0.89 0.92 0.89
#> Ephe 0.72 0.71 0.82 1.00 0.73 0.83 0.74 0.81 0.83 0.79
#> Cole 0.93 0.86 0.93 0.73 1.00 0.94 0.94 0.89 0.92 0.87
#> Dipt 0.91 0.88 0.93 0.83 0.94 1.00 0.92 0.91 0.94 0.89
#> Hydr 0.94 0.85 0.91 0.74 0.94 0.92 1.00 0.88 0.93 0.86
#> Mala 0.87 0.83 0.89 0.81 0.89 0.91 0.88 1.00 0.92 0.86
#> Moll 0.90 0.87 0.92 0.83 0.92 0.94 0.93 0.92 1.00 0.86
#> Olig 0.87 0.81 0.89 0.79 0.87 0.89 0.86 0.86 0.86 1.00
fri.mfa <- mfa(fri.ktab, scan = FALSE, nf = 2)
fri.mcoa <- mcoa(fri.ktab, scan = FALSE, nf = 2)
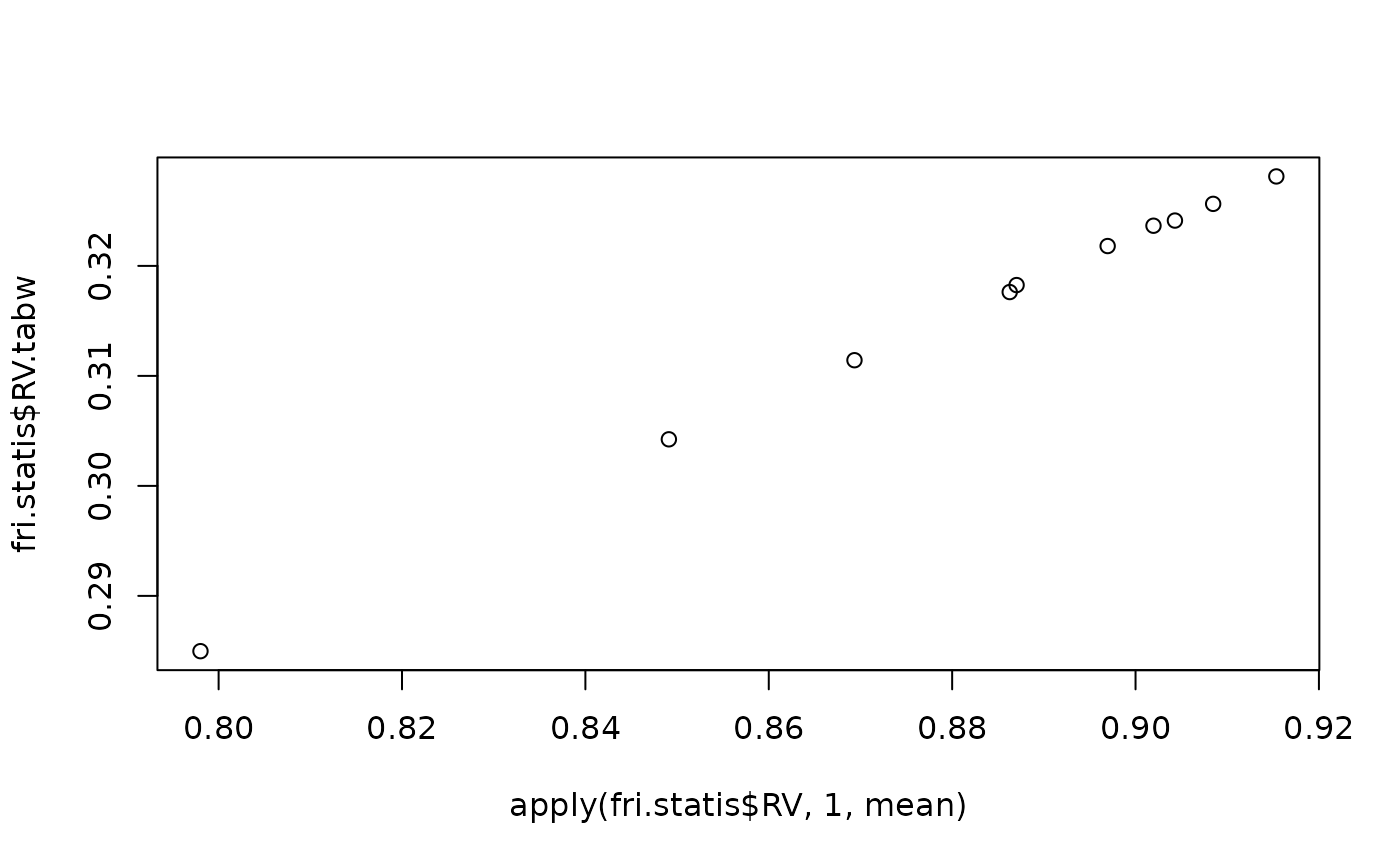
apply(fri.statis$RV, 1, mean)
#> Hemi Odon Tric Ephe Cole Dipt Hydr Mala
#> 0.8870267 0.8491046 0.9042958 0.7980208 0.9019560 0.9153542 0.8969580 0.8862786
#> Moll Olig
#> 0.9084652 0.8693471
fri.statis$RV.tabw
#> [1] 0.3182568 0.3042336 0.3241214 0.2849738 0.3236518 0.3281335 0.3218042
#> [8] 0.3176219 0.3256389 0.3114247
plot(apply(fri.statis$RV, 1, mean), fri.statis$RV.tabw)
 plot(fri.statis$RV.tabw, fri.statis$RV.tabw)
