Decentred Correspondence Analysis
dudi.dec.Rdperforms a decentred correspondence analysis.
Arguments
- df
a data frame containing positive or null values
- eff
a vector containing the reference distribution. Its length is equal to the number of rows of df
- scannf
a logical value indicating whether the eigenvalues bar plot should be displayed
- nf
if scannf FALSE, an integer indicating the number of kept axes
Value
Returns a list of class dec and dudi (see dudi) containing also
- R
sum of all the values of the initial table
References
Dolédec, S., Chessel, D. and Olivier J. M. (1995) L'analyse des correspondances décentrée: application aux peuplements ichtyologiques du haut-Rhône. Bulletin Français de la Pêche et de la Pisciculture, 336, 29--40.
Author
Daniel Chessel
Anne-Béatrice Dufour anne-beatrice.dufour@univ-lyon1.fr
Examples
data(ichtyo)
dudi1 <- dudi.dec(ichtyo$tab, ichtyo$eff, scan = FALSE)
#> Warning: coercing argument of type 'double' to logical
sum(apply(ichtyo$tab, 2, function(x)
chisq.test(x, p = ichtyo$eff/sum(ichtyo$eff))$statistic))
#> Warning: Chi-squared approximation may be incorrect
#> Warning: Chi-squared approximation may be incorrect
#> Warning: Chi-squared approximation may be incorrect
#> Warning: Chi-squared approximation may be incorrect
#> [1] 2851.051
sum(dudi1$eig) * sum(ichtyo$eff) # the same
#> [1] 2851.051
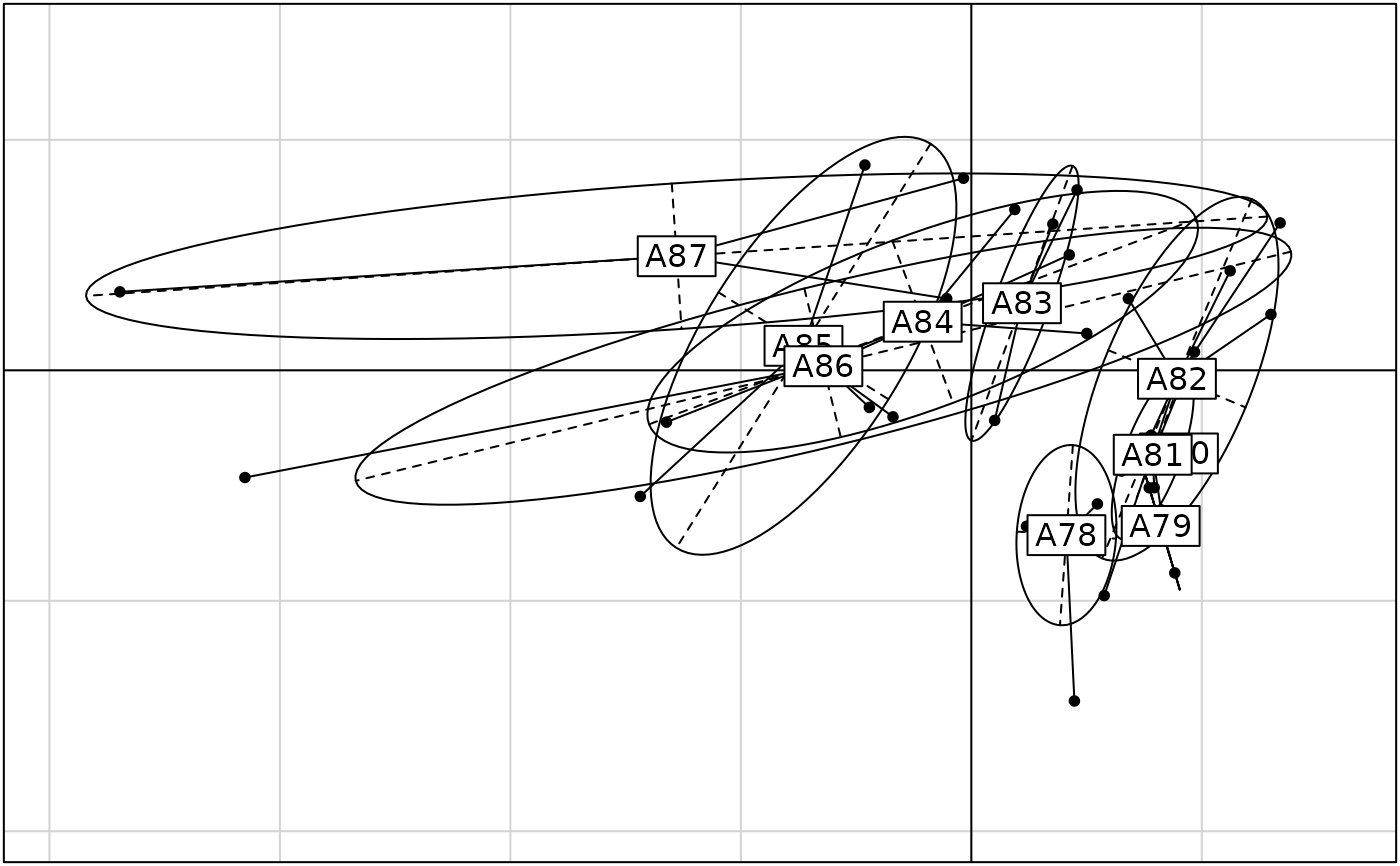
s.class(dudi1$li, ichtyo$dat, wt = ichtyo$eff/sum(ichtyo$eff))