Genetics-Ecology-Environment Triple
butterfly.RdThis data set contains environmental and genetics informations about 16 Euphydryas editha butterfly colonies studied in California and Oregon.
Usage
data(butterfly)Format
butterfly is a list with the following components:
- xy
a data frame with the two coordinates of the 16 Euphydryas editha butterfly colonies
- envir
a environmental data frame of 16 sites - 4 variables
- genet
a genetics data frame of 16 sites - 6 allele frequencies
- contour
a data frame for background map (California map)
- Spatial
an object of the class
SpatialPolygonsofsp, containing the map
Source
McKechnie, S.W., Ehrlich, P.R. and White, R.R. (1975). Population genetics of Euphydryas butterflies. I. Genetic variation and the neutrality hypothesis. Genetics, 81, 571--594.
References
Manly, B.F. (1994) Multivariate Statistical Methods. A primer. Second edition. Chapman & Hall, London. 1--215.
Examples
data(butterfly)
if(adegraphicsLoaded()) {
if(requireNamespace("sp", quietly = TRUE)) {
g1 <- s.label(butterfly$xy, Sp = butterfly$Spatial, pSp.col = "white",
porigin.include = FALSE, plot = FALSE)
g2 <- table.value(dist(butterfly$xy), plot = FALSE)
g3 <- s.value(butterfly$xy, dudi.pca(butterfly$envir, scan = FALSE)$li[, 1],
Sp = butterfly$Spatial, pori.inc = FALSE, pSp.col = "transparent", ppoints.cex = 2,
plot = FALSE)
## mt <- mantel.randtest(dist(butterfly$xy), dist(butterfly$gen), 99)
G <- ADEgS(list(g1, g2, g3), layout = c(2, 2), plot = TRUE)
}
} else {
par(mfrow = c(2, 2))
s.label(butterfly$xy, contour = butterfly$contour, inc = FALSE)
table.dist(dist(butterfly$xy), labels = row.names(butterfly$xy)) # depends of mva
s.value(butterfly$xy, dudi.pca(butterfly$envir, scan = FALSE)$li[,1],
contour = butterfly$contour, inc = FALSE, csi = 3)
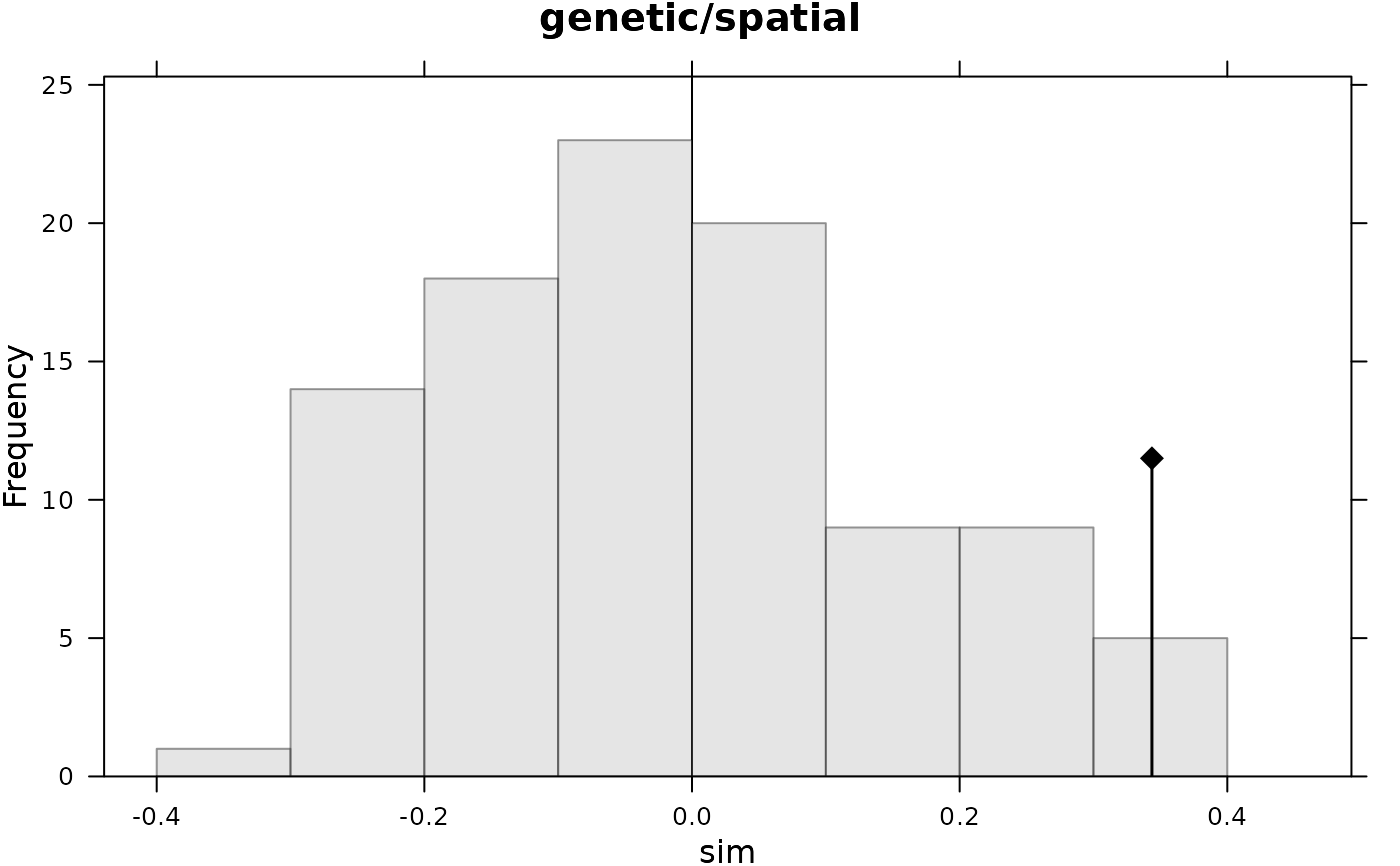
plot(mantel.randtest(dist(butterfly$xy), dist(butterfly$gen), 99),
main = "genetic/spatial")
par(mfrow = c(1,1))
}